The Alert Statistics option in Manager displays information that helps you track the historical trend of database space usage on a weekly and monthly basis, and also the rate at which data is being inserted into your database. By analyzing the trend of the load factors on your database and your hardware, you can set the threshold for the amount of historical data that you want to store at any given time.
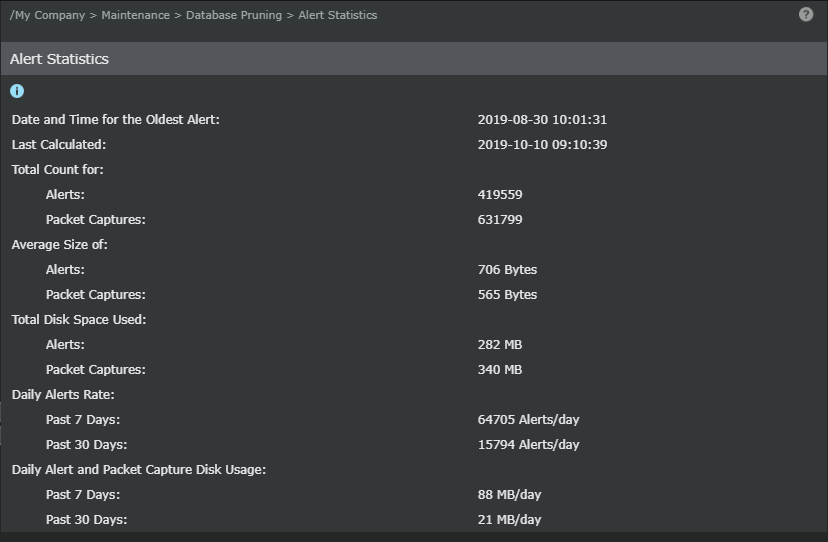
The Manager retrieves and displays the following data from the underlying database:
- Date and Time for the Oldest Alert: displays the date and time
- Last Calculated
- Total Count for
- Alerts
- Packet Captures
- Average Size of
- Alerts
- Packet Captures
- Total Disk Space Used
- Alerts
- Packet Captures
- Daily Alerts Rate
- Past 7 days
- Past 30 days
- Daily Alert and Packet Capture Disk Usage
- Past 7 days
- Past 30 days
These data are retrieved and displayed to enable timely action for avoiding degradation in performance due to issues like storage limitation or volume of data.