After you enable forensic analysis integration using the CLI, the Forensics tab is displayed on the Settings tab of the Web UI with a section on the Settings: Forensics page for each enabled integration.
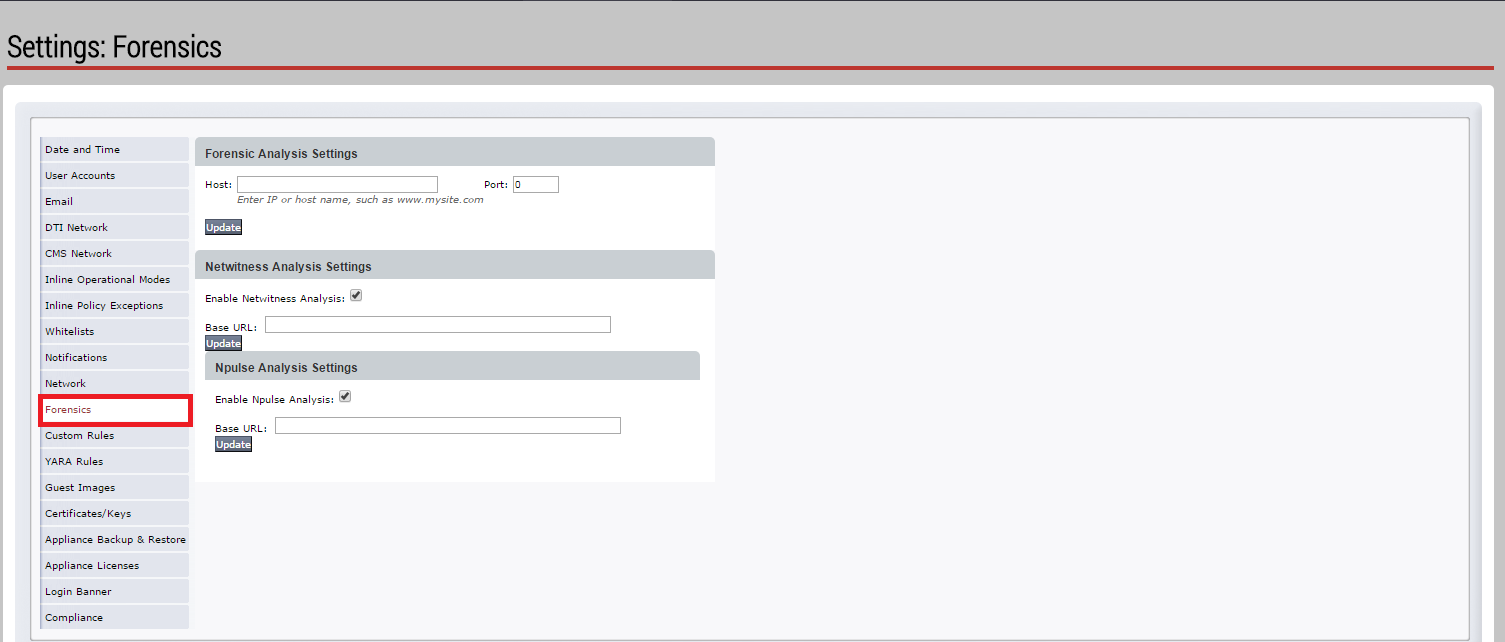
After the integration is configured, links to packet data are available in all alerts on the Alerts tab.

Prerequisites
Administrator or Operator access to the Network Security appliance
Enable integrations with one or more partners. For details about how to enable integration with Solera Networks, see Enabling or disabling forensic analysis integration with Solera Networks using the CLI . For details about how to enable an integration with a Packet Capture platform, see Enabling or disabling forensic analysis integration with a PX Series platform using the CLI . For details about how to enable integration with RSA NetWitness, see Enabling or disabling forensic analysis integration with RSA NetWitness using the CLI.
To configure the integration with Solera Networks:
In the Web UI, choose Settings > Forensics.
In the Forensic Analysis Settings section:
Enter the IP address of the Solera appliance in the Host box.
Enter the port that listens for traffic from the Network Security appliance in the Port box.
Click Update.
To view packet capture (pcap) data:
Click the Alerts tab and then click the Alerts sub-tab.
Click the pcap link associated with the integration.
To configure the integration with RSA NetWitness:
In the Web UI, choose Settings > Forensics.
In the Netwitness Analysis Settings section, enter the NetWitness appliance base URL in the following format:
https://<IP Address>/investigation/<Node ID>/navigate/query
or
http://<IP Address>/investigation/<Node ID>/navigate/query
Note
The URL depends on your specific NetWitness settings.
Click Update.
To view packet capture (pcap) data:
Click the Alerts tab and then click the Alerts sub-tab.
Click the pcap link associated with the integration.
To disable the integration, clear the Enable Netwitness Analysis checkbox in the Netwitness Analysis Settings section.
To configure the integration with a Packet Capture platform:
In the Web UI, choose Settings > Forensics.
In the Npulse Analysis Settings section, enter the PX Series appliance base URL in the following format:
https://<IP Address>/i/searches.html
or
http://<IP Address>/i/searches.html
Click Update.
To view packet capture (pcap) data:
Click the Alerts tab and then click the Alerts sub-tab.
Click the pcap link associated with the integration.
To disable the integration, clear the Enable Npulse Analysis checkbox in the Npulse Analysis Settings section.