Use this file to discover all available pages before exploring further.
The new docs.trellix.com features a modernized UI and AI-powered conversational search. Content is currently available in English, with additional languages expected in early November 2026. We hope you enjoy the updated experience.
Select the core attribute as
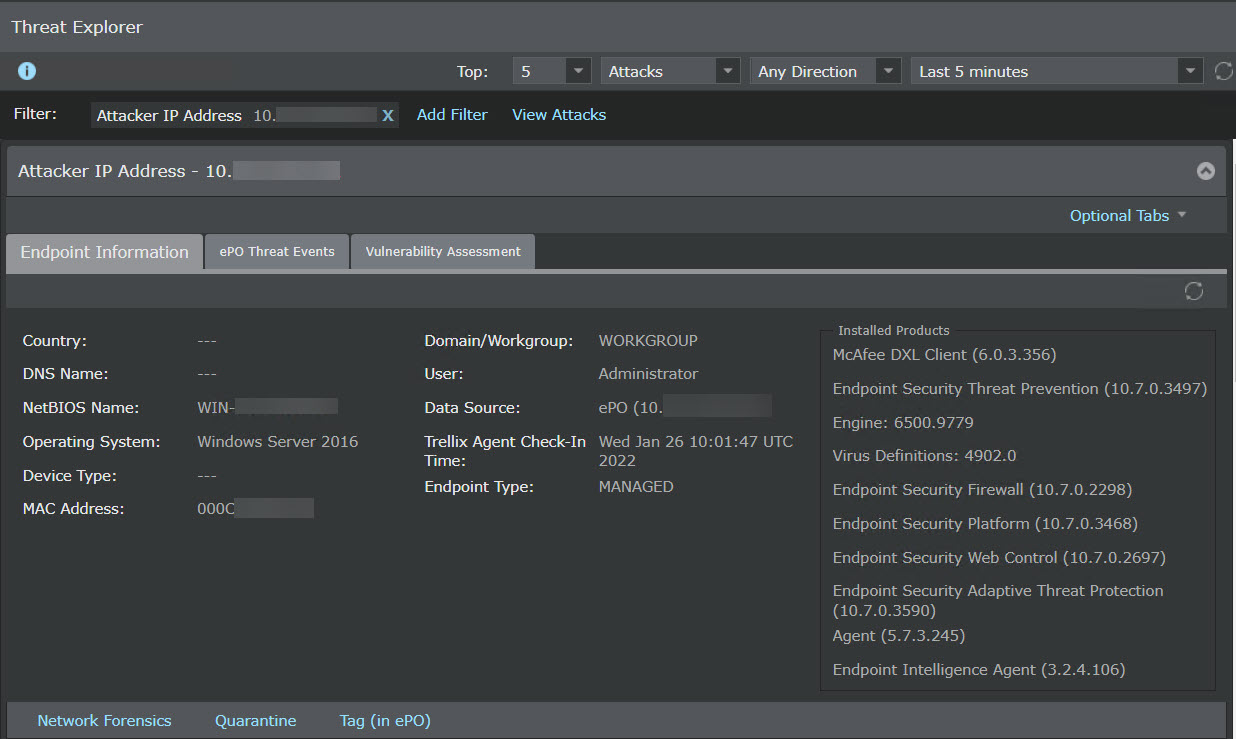
Attacker IP Address and click the hyperlink to view the following details:
Endpoint Information
ePO Threat Events
Vulnerability Assessment
Endpoint Information
The additional information displayed in the Endpoint Information section is shown in the following table.
Item
Description
Country
Country of the endpoint
DNS Name
DNS name of the endpoint to resolve the names to IP addresses
NetBIOS Name
NetBIOS name of the endpoint to access the host machines
Operating system
Operating system platform of the endpoint
Device Type
Type of the Sensor (for example, IPS Sensor)
MAC Address
MAC address of the endpoint
Domain/Workgroup
Domain or workgroup of the endpoint
User
Operating system user name of the endpoint
Data Source
Database tables from where information is retrieved
Trellix Agent Check-In Time
Check-in time of the
Trellix Agent that communicates with the same ePO server integrated with the admin domain
Endpoint Type
Type of endpoint:
UNMANAGED (No Agent)— This indicates that there is no
Trellix Agent installed on the endpoint.
UNMANAGED (MANAGED)— This indicates that the endpoint has a
Trellix Agent but there is no active communication channel between the Agent and ePO server integrated with the admin domain.
Installed products
List of the installed products
The
Endpoint Information sub-tab shows the following details specific to the endpoint.
Network Forensics — Click this tab to analyze the network behavior of the endpoint when NTBA is configured.
Network Forensics page You can filter your view by choosing the time and date of your choice.
Date and time options in Network Forensics page You can view the data according to your time preference by selecting the time period from the drop-down list. You can use the
icon to view the details before and after any event/attack.
Show option The following table shows the information displayed in the
Network Forensics section.
Item
Description
Summary
Endpoint summary that includes IP address, country of the endpoint, etc. View the client connections from this endpoint that include the TCP services, UDP services, etc. View the server connections to this endpoint that include the TCP services, UDP services, etc.
Suspicious Flows
Suspicious activity indicator
View indicators that map to an event like an alert or attack.
IP Address
Specify an IP address and use Search to view flows for this address.
Time
Displays the date and time when the suspicious flow for an event occurred
Tip
You can sort the flows view based on time.
Suspicious Activity
Displays the indicator that specifies the suspicious activity performed like an URL accessed that was involved in another attack, blocked executable accessed and others
Source
Specifies the source from which the flow was initiated for an endpoint. Details include endpoint and ports used.
Destination
Specifies the destination details like endpoint involved and port
Applications
Displays the applications accessed from the endpoint
Attack
Attacks for a specific endpoint that include attack name and result
File / URL Accessed
Specifies file or URL access details for a specific endpoint
To close the network forensics page, click the
icon.
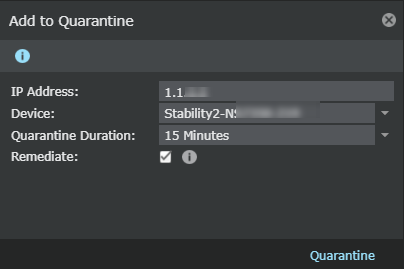
Quarantine — Use this option to block all the traffic originating from the specified IP address seen on the selected device for the selected time.
Quarantine Endpoint dialog
To quarantine endpoints to block all the traffic originating from the specified IP address:
Option
Definition
IP Address
Enter the IP address of the endpoint.
Device
Select the specific device of the endpoint whose traffic originating from the IP address you want to block.
Quarantine Duration
Select the quarantine duration from the drop-down list.
Remediate
Select the checkbox to redirect the configured endpoint to the configured remediation portal.
Note
You can configure the remediation portal settings in
Devices → Global → IPS Device Settings → Quarantine → Remediation Portal
Remediation cannot be configured for IPv6 address. The checkbox and the information icon for remediation is not displayed if you enter an IPv6 address in the
IP Address field.
Click
Quarantine. The endpoint is added and displayed in the
Quarantine page.
Tag (in ePO)— Use this option to assign a tag to the selected endpoint in
Trellix ePO - On-prem.
You are able to assign tags only to endpoints whose
Endpoint Type denotes MANAGED. This means that the endpoint runs a suitable version of
Trellix Agent and is managed by
Trellix ePO - On-prem.
To assign a tag:
Select a tag from the drop-down list. If the tag you looking for does not appear in the list, click the refresh button.
Click
Tag.
If the tagging is successful you receive a message stating its success. If not, you receive a failure notification.
ePO Threat Events
The
ePO Threat Events sub-tab displays the latest
50 Threat Events listed in the
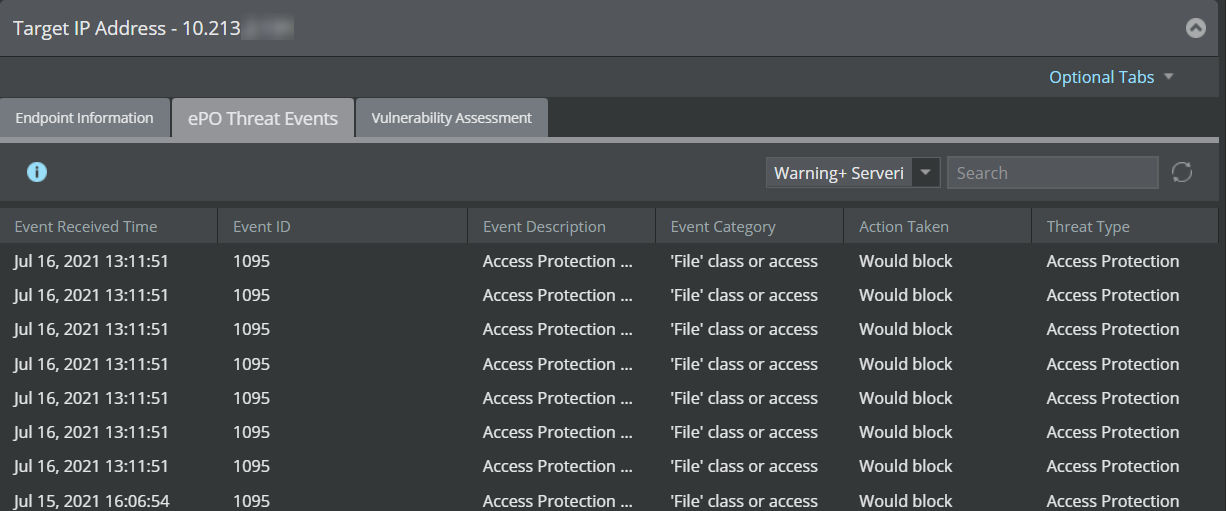
ePolicy Orchestrator - On-prem for a selected endpoint. The information displayed under this sub-tab includes the date and time at which the threat event was generated, the ID associated with the event, the event description, event category, action taken on the event, and the type of the threat that triggered the event.
You can click the
icon to refresh the list and view the latest
50 Threat Events listed in the
ePolicy Orchestrator - On-prem for the selected endpoint. The
Search text field allows you to search for a specific event based on the
Event Received Time,
Event ID,
Event Category and
Threat Type. For example, to view all events associated with the Event ID 1095, type
1095 in the
Search field.
Note
The sub-tab has
Any Severity filter selected by default. With this filter selected, the sub-tab displays all types of events including those which are informational and/or of low-severity. Such events act as noise and impede one's ability to find true threats. To exclude these events, select the
Warning+ Severity Only filter from the drop-down menu. This displays only those events with Critical, Alert and Warning severity.
Note
Ensure that the ePO server has the latest
Trellix IPS Extension file installed. For information on how to download and install the
Trellix IPS Extension, see the section
Install
Trellix IPS extension file in
Trellix ePO - On-prem in
Trellix Intrusion Prevention System Integration Guide.
ePO Threat Events sub-tab
Vulnerability Assessment
The
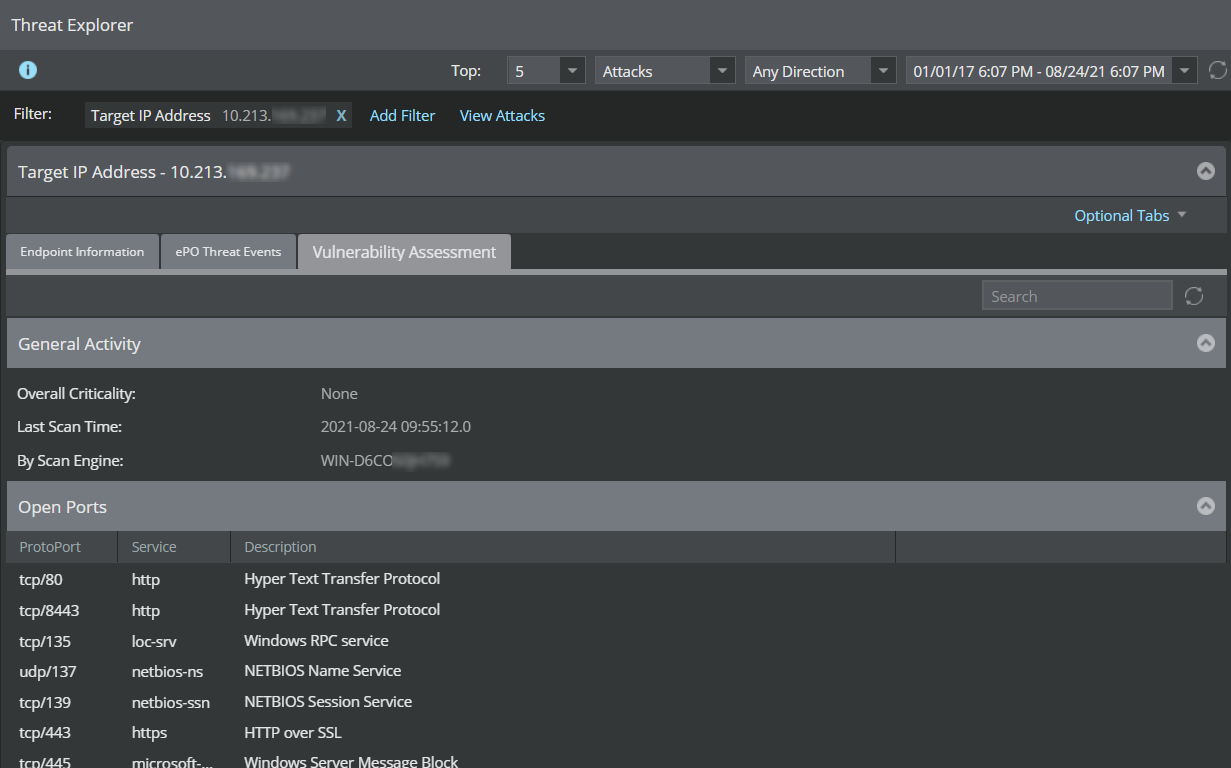
Vulnerability Assessment sub-tab displays the following details. This tab will be populated with vulnerability assessment scan results for the selected endpoint when integration with McAfee Vulnerability Manager (MVM) is enabled.
Vulnerability Assessment sub-tab
To scan for vulnerabilities:
Click
button to scan for vulnerabilities against the selected host.
Note
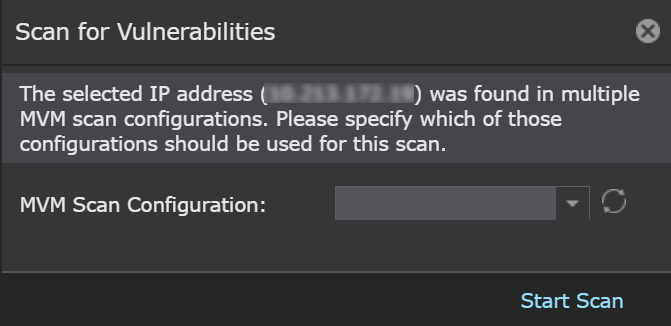
If the selected IP address is found in an MVM scan configuration, it displays a message to inform that the scan is successful. If the selected IP address is found in more than one available MVM scan configuration, the
Scan for Vulnerabilities window is displayed.
Vulnerability Assessment sub-tab
Select an MVM configuration from the
MVM Scan Configuration drop-down list.
Click
Start Scan
to run the scan.
Note
To refresh the configuration, click
.
Note
If the selected IP address is not found in any of the MVM scan configuration, a warning message is displayed informing that the default configuration will be used for the scan. Click
OK to proceed with the scan.
Scan for Vulnerabilities option is available only when integration with Vulnerability Manager is enabled and if you have edit privileges to run the scan.
Item
Description
General Activity
The following details are displayed:
Overall Criticality: Criticality level of the endpoint
Last Scan Time: Date and time of the latest scan
By Scan Engine: Name of the scan engine
Open Ports
The following open port details are displayed:
Protoport: Port ID
Service: Name of the service running on the port
Description: Description of the service
Vulnerabilities
The following vulnerability details are displayed:
Risk: Specifies the risk level. Example: Informational.
Name: Name of the service running on the port
CVE: CVE ID hyperlink of the vulnerability that displays more information on the vulnerability
At any time, you can click
to leave the selected core attribute and return to the main
Threat Explorer page.
.png)
.png)
 icon to view the details before and after any event/attack.
.png)
.png) icon.
icon.
 icon to refresh the list and view the latest
50 Threat Events listed in the
ePolicy Orchestrator - On-prem for the selected endpoint. The
Search text field allows you to search for a specific event based on the
Event Received Time,
Event ID,
Event Category and
Threat Type. For example, to view all events associated with the Event ID 1095, type
1095 in the
Search field.
icon to refresh the list and view the latest
50 Threat Events listed in the
ePolicy Orchestrator - On-prem for the selected endpoint. The
Search text field allows you to search for a specific event based on the
Event Received Time,
Event ID,
Event Category and
Threat Type. For example, to view all events associated with the Event ID 1095, type
1095 in the
Search field.
 button to scan for vulnerabilities against the selected host.
 to leave the selected core attribute and return to the main
Threat Explorer page.
to leave the selected core attribute and return to the main
Threat Explorer page.