The first page that you view after a successful logon to the Manager is the Dashboard page.
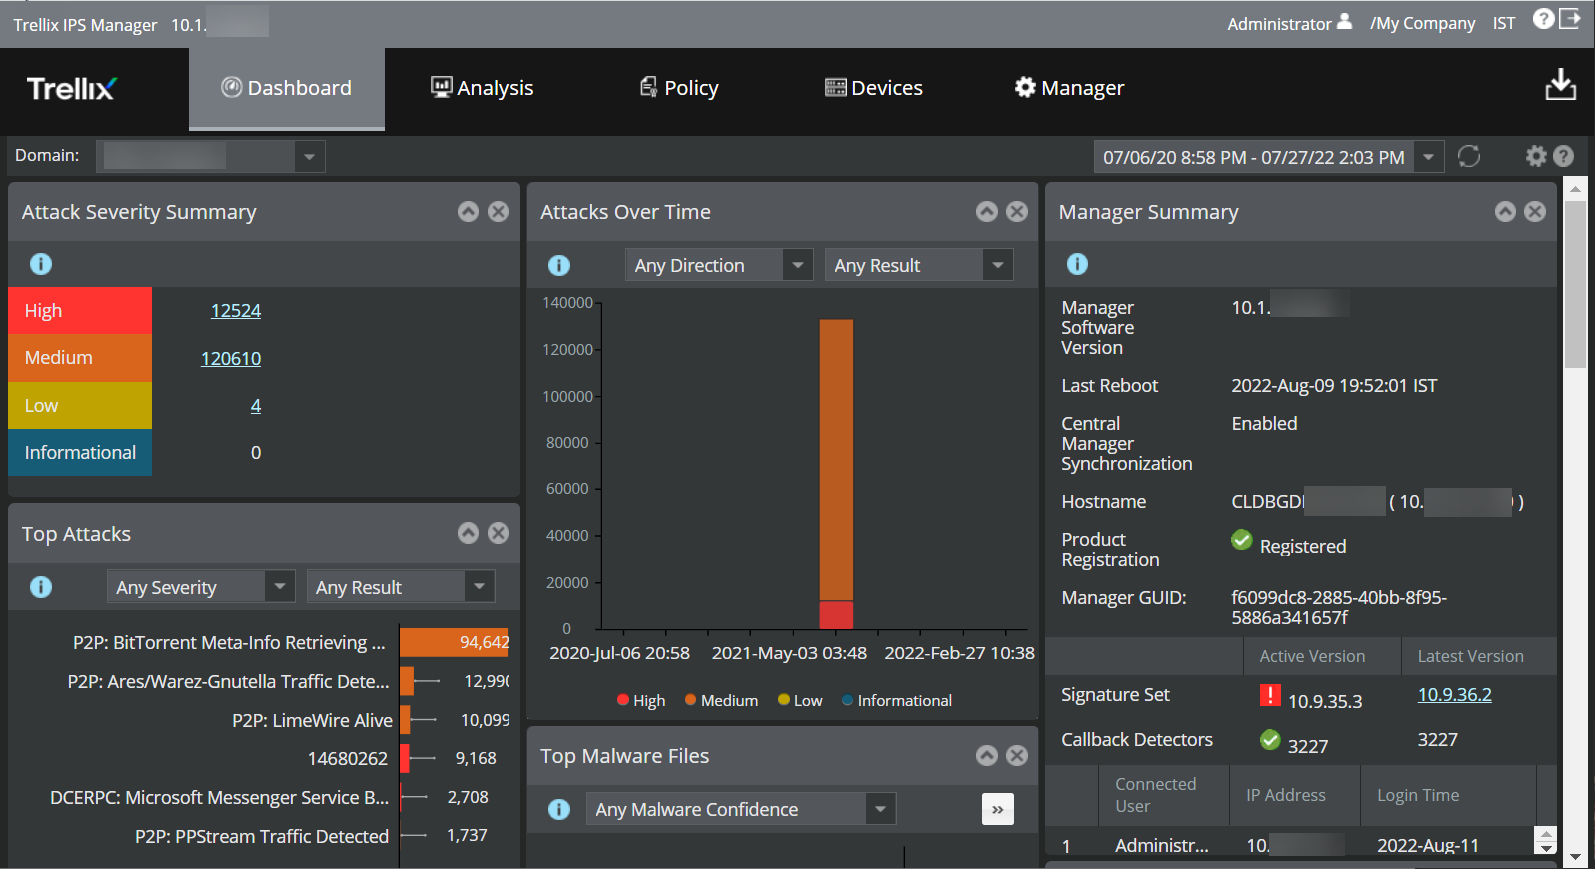
The Dashboard page is the central interface from which all Manager interface components are available. The Dashboard page is logically divided into two sections: the top Menu bar and the lower Monitors section.
Dashboard Settings
The Dashboard Settings dialog enables you to further customize your Dashboard page view.
You can perform the following tasks here:
- Monitors — Use this option to add the monitors. The default category is
All. Use the
Operational or
Security category to choose the monitors you want to view. You can also customize the data displayed in the monitors based on the admin domain and child domain. Monitors display data based on the admin domain selected from the
Domain drop-down list.
The following monitors are displayed under different categories: All, Operational, and Security monitors.
Category Monitors Description All View both Operational and Security monitors. Operational CPU Usage View the high CPU usage of the Sensor. Device Summary View the current versions of the Sensor software and signature set of the logged in domain. Manager Summary View the Manager details such as software version, signature set version, and others. Memory Usage View the high memory usage of the Sensor. Release Announcements View the latest updates and the current version of signature set applied to your Sensor. Running Tasks View the status of all the Sensors configured in the Manager. System Faults View the health of your device and the Manager. Throughput Usage View the high throughput usage of the Sensor. Note
Data remains unchanged for the Manager summary, Release Announcements, and Running tasks monitors irrespective of the admin domain selected. The System Faults and Device Summary monitors display the list of all the child domains linked to the admin domain selected.
Security Attack Severity Summary View the unacknowledged alerts in the database, sorted by alert severity Attacks Over Time View the attacks over a period of time in your network. Big Movers View the attacks whose frequency has increased during a selected time period. Top Applications (IPS) View the top applications based on attacks, bytes, or connections. Top Applications (NTBA) View the top applications in the NTBA device based on bytes or connections. Note
At least 1 NTBA appliance is required to be configured to view this monitor.
Top Attack Subcategories View the attack subcategories in your network. Top Attacker Countries View the top attacker countries in your network. Top Attackers View the top attackers in your network. Top Attacks View the top attacks in your network. Top Callback Activity View the callback activity. Top Destinations (NTBA) View the top destinations based on bytes or connections. Note
At least 1 NTBA appliance is required to be configured to view this monitor.
Top Endpoint Executables (NTBA) View the top executables based on number of endpoints using them or the number of attacks they have initiated. You can filter the executables based on the device, attacks (default) or endpoints, malware confidence, and classification. Note
This monitor is populated only if you have enabled McAfee EIA integration.
Top Endpoints Using Risky URLs View the top endpoints using risky URLs in your network. Top Files (NTBA) View the top files based on malware confidence level. Note
At least 1 NTBA appliance is required to be configured to view this monitor.
Top High-Risk Endpoints View the high-risk endpoints of your network. Top Malware Files View the top malware downloads in your network. You can filter malware based on their confidence and detections (blocked, unblocked, and all). Top Risky URLs View the top risky URLs of your network. Top Sources (NTBA) View the top sources based on bytes or connections. Note
At least 1 NTBA appliance is required to be configured to view this monitor.
Top Target Countries View the top target countries in your network. Top Targets View the top targets in your network. Top URLs (NTBA) View the top URLs at risk. Note
At least 1 NTBA appliance is required to be configured to view this monitor.
Note
The Dashboard displays only the top 10 unacknowledged alerts under each Security Monitor. To view the acknowledged alerts, go to the Attack Log page and select Acknowledged from the drop-down list. You can also select Any Alert State from the drop-down list, and the Manager will display both acknowledged and unacknowledged alerts.
- Automatic Refresh — Use this option to set the automatic refresh time. The default time is 10 minutes. The minimum and maximum time for the automatic refresh are 1 minute and 10 minutes, respectively. For a manual refresh, select Disabled to disable the automatic refresh.
- Layout — Use this option to customize the number of columns to be displayed in the
Dashboard page. The default layout is 3 columns. The minimum and maximum number of columns that can be displayed are 2 columns and 4 columns, respectively.
The following figure shows the Dashboard with a three-column view.
Three-column view 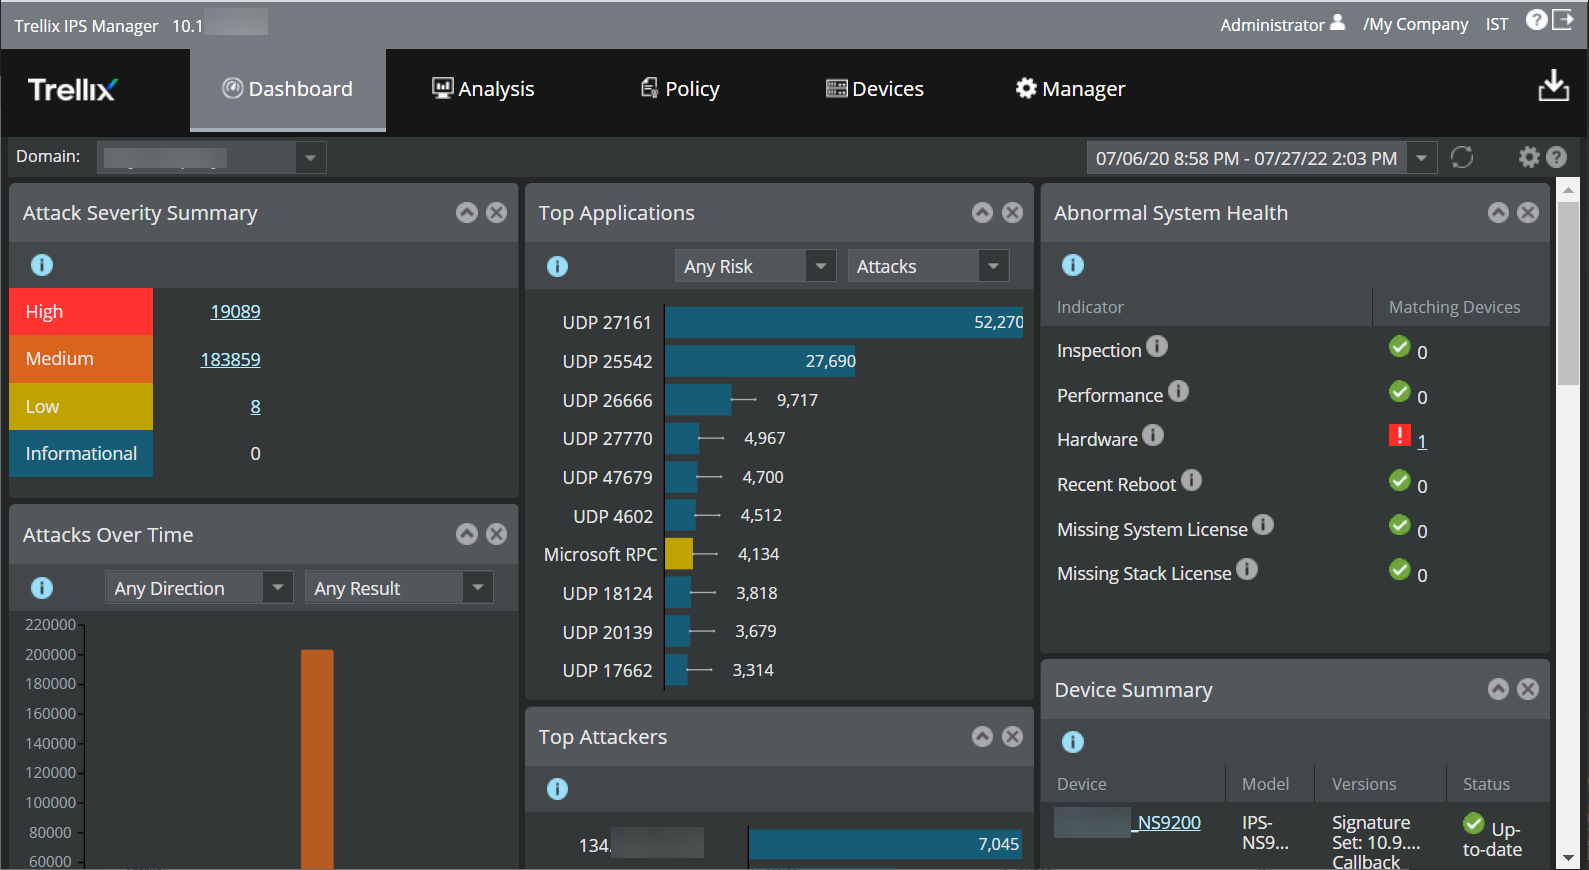
- Time Range — Use this option to select the time range to set the time range for viewing data on the selected monitor.
For example, if you select Automatic Refresh time as 10 minutes and the Time Range as 1 hour, then the information available for the selected monitor will be for the last 1 hour from the last refresh time. That is, if you select the Time Range at 9:30 AM, then you can view the data from 8:30 AM to 9:30 AM. But, as soon as the monitor is refreshed after 10 minutes, the data displayed on the Dashboard will be from 8:40 AM to 9:40 AM.