The volume of alerts generated in the Attack Log makes it difficult for the analysis of alerts. The different sorting and filtering options provided in the Attack Log helps drill-down only the necessary alerts for further analysis. Use the arrow keys at the bottom of the page to navigate back and forth between the alert pages.
Sort alerts
Alerts when generated are in unacknowledged state. Once an alert is acknowledged, a tick mark appears next to the alert in the acknowledged and unacknowledged column. You can sort the alerts by selecting any one of the three options, Unacknowledged, Acknowledged and Any Alert State. You can also sort the alerts based on the period in which the alerts were generated. The Custom Time Period option lets you customize the time period.
When the time period option is selected, the display shows the alert, attack counts, and other parameters for the chosen time period. The alert count displays the number of times each attack has been reported within the parameters. For example, for a query, there are two reported alerts (number of alerts = 2) and two reported attacks (attack count = 2) for the "ARP: ARP Spoofing Detected" attack. Thus, the "ARP: ARP Spoofing Detected" attack was detected and reported exactly twice during the queried period. Also, the number of alerts and attack count for the "Samba Trans2Open Buffer Overflow" attack: 74 alerts have been generated for this attack; however, there were 2133 attack instances. One or more attack instances was suppressed according to the configuration set.
When looking for a particular alert, you can enter the keyword for the alert in the Quick Search field and the results are automatically displayed in the log. Click Clear All Filters to undo all the filters applied.

The Clear All Filters button color changes to orange which indicates that a filter is active, and that the attack log is not displaying all the alerts. For example, if you want to filter the alerts detected by MVX engine, type mvx or MVX in the Quick Search field. The Clear All Filters button color changes to orange and the Manager filters MVX specific alerts.
.png)
Filter alerts
You can customize the columns in the Attack Log to view only the necessary details about the alert. You can rearrange/resize the columns to view the details according to your preference. Following are the column options for the alerts:
| Column header | Description |
|---|---|
| Acknowledged/unacknowledged alerts | The tick mark indicates that the alert is acknowledged. |
| Attack Severity | Indicates different colors based on the attack severity, high/medium/low/informational |
| Name | Name of the attack |
| Event | Displays various information about the attack
|
| Attack | Displays specific information about the attack
|
| Packet Capture | You can export the packet capture for that alert. |
| Attacker | Displays details about the attacker endpoint
|
| Target | Displays details about the target endpoint
|
| Malware File | Displays details about the attack in case of malware attacks
|
| Callback Activity | Displays details about the callback activity for BOT attacks
|
| Endpoint Executable | Displays details about the endpoints running the executables
|
| Application | Displays the Layer7 applications involved |
| Detection | Displays details about the Sensor that detected the attack
|
| Layer 7 Data | Displays the following layer 7 data field details:
You can view the protocols/fields that are enabled in the L7 Data Collection page under Devices → <Admin Domain Name> → Devices → <Device Name> → Setup → Advanced. You can also customize the settings for the protocols/fields in the L7 Data Collection page. The default Percentage (%) value of flow memory re-allocated to collect layer 7 data is 20%. |
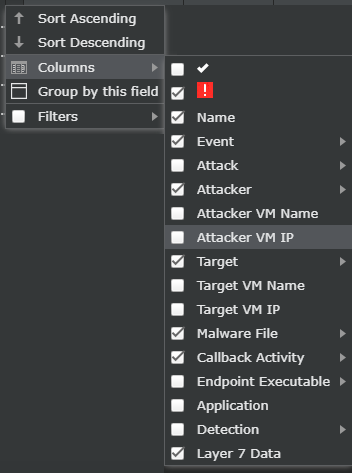
In addition to the column filters, there are specific sub-filters for each column. These sub-filters are based on specific values for that column. For example, the Direction column will have Inbound, Outbound, Unknown, and Bi-directional as the sub-filters. The alerts are filtered based on the selected option. Further, the Sort Ascending and Sort Descending options for each column toggles the alerts either in ascending order or descending order.
Automatic refresh of alerts
Alerts in the Attack Log page can be refreshed automatically. Refer the following steps to enable or disable automatic refresh:
Note
Alerts can be refreshed manually by clicking
.
.png)
- Click
 .
.
The Attcak Log Settings dialog box is displayed.
Attack Log Settings 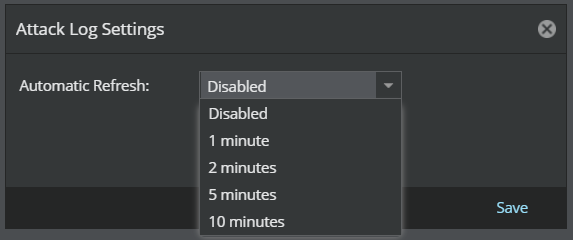
Note
Make sure that the set time period to fetch alerts is greater than the automatic refresh interval to not lose any alert data.
- From the
Automatic Refresh drop-down, select the refresh interval based on your requirement.
Note
To disable automatic refresh select Disabled from the drop-down.
- Click Save.
Note
The Attack Log page refreshes automatically every time you visit the page from the Dashboard tab, Threat Explorer, Network Forensics, etc. when the Automatic Refresh is enabled.
Note
When you select an alert in the Attack Log page, with auto refresh enabled, the alert remains selected with the details panel still displaying the alert data though new alerts are added to the page.