This topic covers the following information:
Report overview
Report prerequisites
Generating an IPS policy configuration summary report (Web UI)
Scheduling an IPS policy configuration summary report (Web UI)
Report overview
The IPS Policy Configuration Summary report provides a high-level view of active IPS policies.
You can request the report to be output as a PDF file or as a CSV file in the /data/reports folder on the local drive. The format of the report file name is ips_policy_configuration_summary_hostName_dateCreated_timeCreated, where hostName is the host name assigned to your appliance, and dateCreated and timeCreated identify the date and time the report was created.
The report contains the following sections for each active monitoring interface:
Identification of active IPS policies by monitoring interface
At the top of the report, two colored boxes identify the active IPS policies by monitoring interface.
In the following example, the platform has one monitoring interface and the default IPS policy Comprehensive is active on the interface:

In the following example, the platform has two monitoring interfaces and the custom IPS policies a_policy and b_policy are active on the interfaces:

Count of active and excluded rules per active monitoring interface
The first interface-specific section of the report displays two colored boxes:
Active Rules—The number of active IPS rules for the active monitoring interface.
Rules Excluded—The number of IPS rules explicitly excluded by an attribute of the IPS policy applied to the monitoring interface. Note: You can configure rule-exclusion and rule-inclusion attributes for custom IPS policies only.
In the following example, the IPS policy applied to the monitoring interface matches 1199 IPS rules in the appliance database. If the IPS policy is configured with IPS rule exclusion attributes, none of those attributes affect the matched IPS rules, because the number of Rules Excluded is 0.

Summary of active rules per active monitoring interface
For each active monitoring interface, the second section of the report breaks down the active rules (but not the excluded rules) into the following statistics:
Protocol
Number of IPS rules that cover vulnerabilities in each protocol, such as HTTP, NetBIOS, POP3, DNS, DHCP, and Telnet. For more information, see the Rule Match Attributes section in Attributes of IPS policies.
Note
Default IPS policies do not use the name of the exploited protocol as a rule-selection criterion.
Attack target
Number of IPS rules that cover vulnerabilities related to each target host type, such as client, server, or client or server. For more information, see the Rule Match Attributes section in Attributes of IPS policies.
Threat category
Number of IPS rules that cover vulnerabilities within each supported threat category, such as denial_of_service, exploit, and other. For more information, see the Rule Match Attributes section in Attributes of IPS policies.
Note
Default IPS policies do not use the name of the exploited protocol as a rule-selection criterion.
Number of IPS rules by threat severity level
Number of IPS rules that cover vulnerabilities within each supported threat severity range: Critical (7 ‑ 10); Major (4 ‑ 6); Minor (1 ‑ 3). For more information, see the Rule Match Attributes section Attributes of IPS policies.
IPS policy match attributes
Lists each match attribute specified in the IPS policy. For more information, see the Rule Match Attributes section in Attributes of IPS policies.
Note
Default IPS policies do not use the name of the exploited protocol or the threat category as a rule-selection criterion.
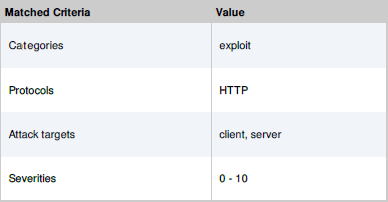
In the following example, a custom IPS policy specifies match criteria for the exploit threat category, for the HTTP protocol, for both the client and server as attack targets, and minimum and maximum severity levels 1 and 10.
Report prerequisites
Log in to the Web UI of the IPS appliance as Monitor, Analyst, Operator, or Admin.
Generating an IPS policy configuration summary report (Web UI)
To generate an IPS policy configuration summary report:
Choose Reports > Reports.
In the Report Type field, select IPS Policy Configuration Summary,
In the Report Format field, select the report output format.
pdf—Write the report to an Adobe PDF file.
csv—Write the report to a CSV file.
Click Generate Report. The page confirms receipt of your request.
When the report is complete, a link to the report file appears below the Generate Reports label.
Scheduling an IPS policy configuration summary report (Web UI)
To schedule an IPS policy configuration summary report:
Choose Reports > Schedule.
In the Scheduled field, select the report frequency:
hourly
daily
weekly
monthly
In the Time fields, specify the report time.
If you selected a weekly report, specify the report day of the week in the WeekDay field.
If you selected a monthly report, specify the report day of the month in the MonthDay field.
In the Delivery field, select the report delivery method:
email—Deliver the report as a file attached to email. For information about configuring email notification, see the Network Security User Guide.
file—Deliver the report as a file linked from the Web UI.
In the Report Type field, select IPS Policy Configuration Summary,
In the Report Format field, select the report output format.
pdf—Write the report to an Adobe PDF file.
csv—Write the report to a CSV file.
Click Schedule Report. The page confirms receipt of your request.
When the report is complete, a link to the report file appears below the Generate Reports label.