You can manually quarantine endpoints and also view endpoints in quarantine.
Task
- In the Manager, click the Analysis tab and select the domain from the Domain drop-down list.
-
Select
Quarantine. The
Quarantine page is displayed.
Quarantine page 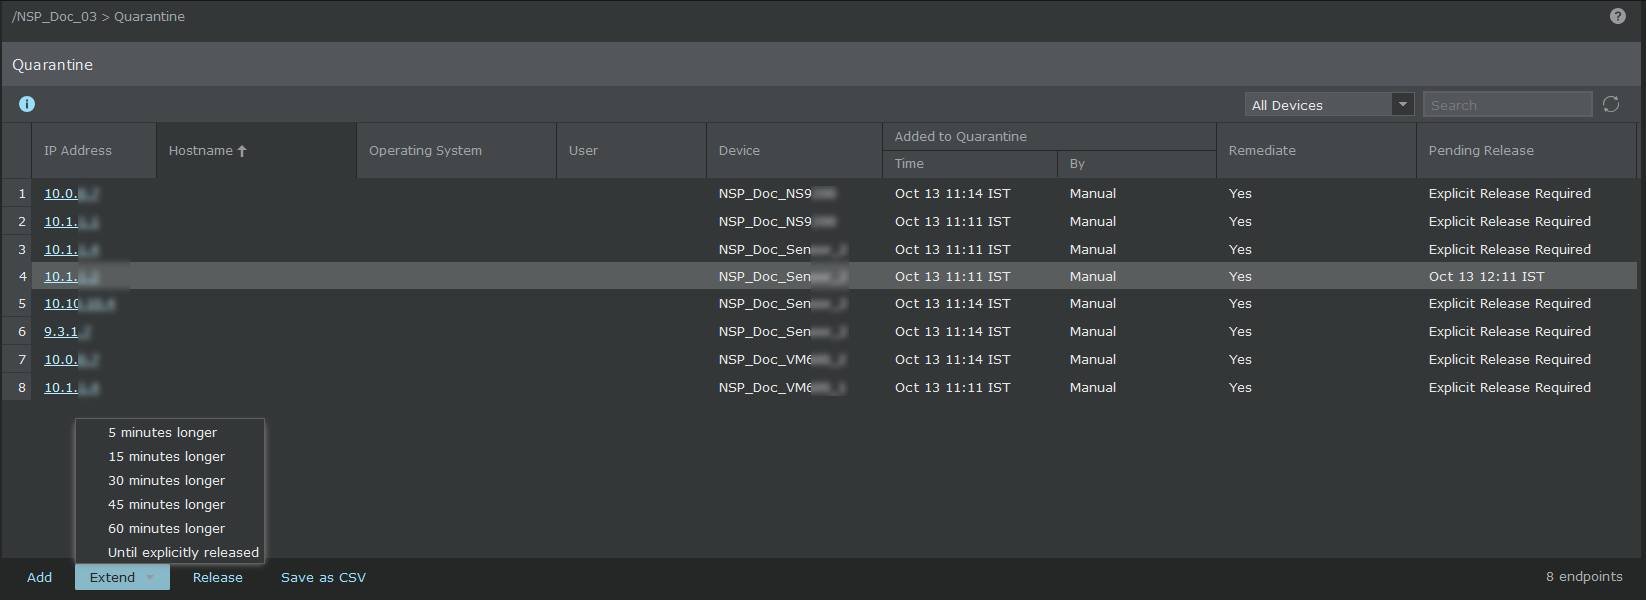
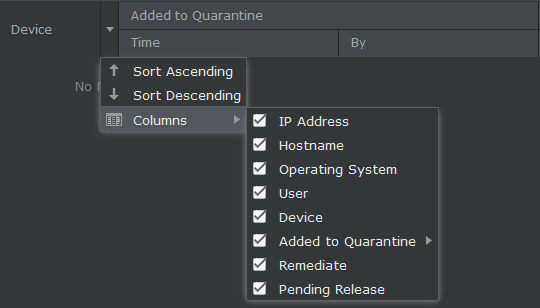
Click a column header and select the option to sort based on ascending or descending order. The options are Sort Ascending and Sort Descending. The column based on which the list is sorted is indicated in the column header by an up arrow icon for ascending order and down arrow icon for descending order.The Quarantine page displays the following details:
Quarantine page.
You can filter the display of columns by clicking a column header and then select or unselect the checkbox for the list of columns you want to view in theOption Definition IP Address Displays the IP address of the quarantined endpoint. Hostname Displays the name of the quarantined host. Operating System Displays the operating system of the quarantined host. User Displays the user name of the quarantined host. Device Displays the Sensor on which the endpoint is quarantined.
Added Specifies the time when the endpoint was first added to quarantine and the name of the attack or administrative user triggering the quarantine. Click the hyper link to view the attack description in the attack encyclopedia. Remediate Specifies if the quarantined host is redirected to the remediation portal or not (displays Yes or No). Note
Remediation is applicable only to IPv4 address.
Pending Release Specifies the time when the endpoint is scheduled to be released from quarantine. Add Click here to add a new IP address to be quarantined on a Sensor.
Extend Click here to extend the quarantine time of an IP address. Release Click here to release an IP address from quarantine on a Sensor. Save as CSV Saves all the quarantined host list in .csv format. Filter options