View Throughput Usage
View Device Throughput Usage
You can view the Sensor throughput usage for the selected device. The unit used for plotting the charts is percentage. Each Sensor is rated for an official maximum throughput, and the throughput usage data displayed in the charts is a percentage of that maximum throughput. Sensors can max out above that maximum rating depending on the type of traffic.
Note
The maximum number of records displayed for a selected device is 10,000.
.png)
View Port Throughput Usage
You can view the port throughput usage for a specific interface depending on the device selected. The unit used for plotting the charts is Mbps. Device throughput data is displayed by default. To view data for port throughput, select Port Throughput Usage from the drop-down list.
To view the port throughput for a particular or multiple interfaces, select the interfaces displayed at the bottom of the charts. To hide the throughput for an interface, deselect that specific interface.
View the Memory usage
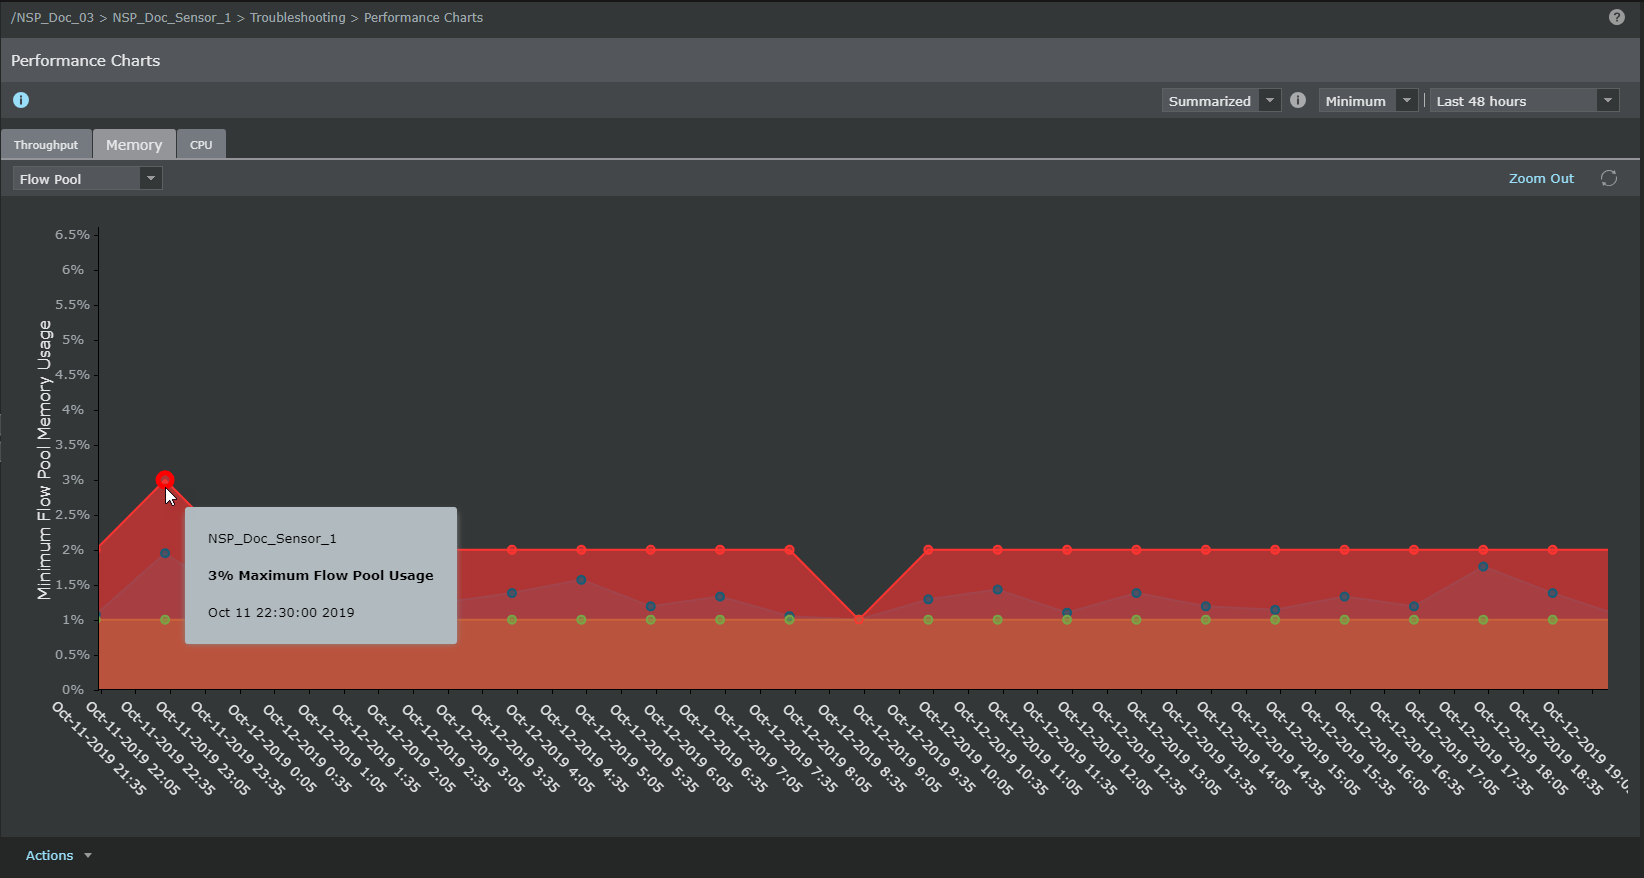
You can view the memory usage which helps monitor the usage before reaching the threshold limit. The unit used for plotting the charts is percentage. The following metrics are displayed:
- Flow pool — The percentage of memory allocated to inspect all flows. This is the default metric.
- Decrypted Flow Pool — The percentage of memory allocated to inspect decrypted SSL flows
- Packet Buffers — The percentage of the packet buffer used by the Sensor
- System Memory — The percentage of the system memory used by the Sensor
View the CPU Usage
CPU usage is the usage that represents the combined usage of software processing in the datapath along with the throughput usage in the Sensor. You can view the device CPU usage which helps monitor the CPU usage before it reaches the threshold limit. The unit used for plotting the charts is in percentage.
Note
By default, a fault message will be generated if the CPU usage goes beyond 90%.
.png)
The Actions menu at the bottom of the page allows you to perform the following actions:
- Save as Image File (PNG) - This allows you to save the charts as an image file in SENSORNAME-METRIC_Performance-YYYYMMDD_hhmm.PNG format.
- Manage Performance Metric Collection - This opens the Devices → Setup → Performance Monitoring → Summary page.
- Manage Performance Data Storage - This opens the Manager → Maintenance → Database Pruning → File and Database Pruning page.
Note
This option is available only if you have access to the Manager menu.