Use this file to discover all available pages before exploring further.
The new docs.trellix.com features a modernized UI and AI-powered conversational search. Content is currently available in English, with additional languages launching in early November 2026. We hope you enjoy the updated experience.
Use the health check results for further analysis or for troubleshooting purposes.
Task
Select
Manager → <Admin Domain Name> → Troubleshooting → Health Check. The
Health Check page is displayed.
The
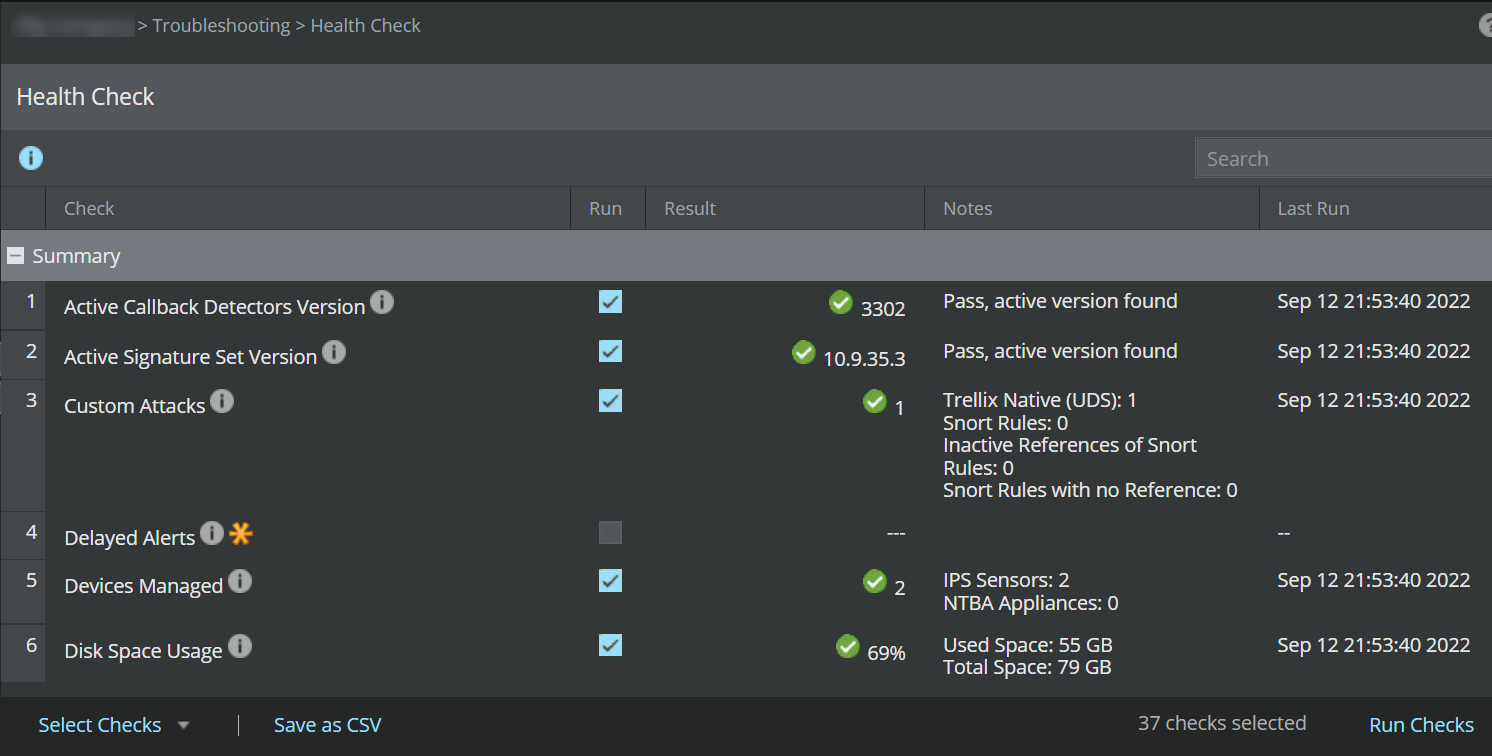
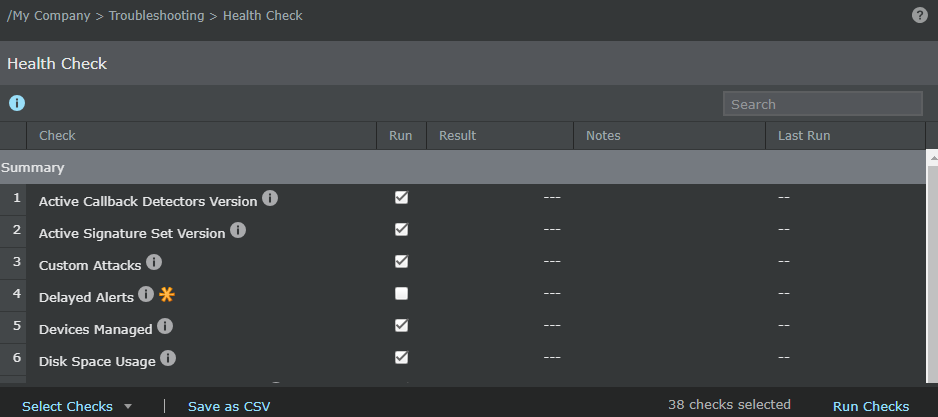
Health Check page displays with the following fields.
Field Name
Description
Check
Displays the list of health checks available in the Manager. The health checks lists are grouped into the following categories:
Summary - Checks on basic summary of Manager's performance, for example, the memory currently free in the Manager
Database check - Checks the database, for example, the number of alerts that are stored in the database
Connectivity checks - Checks the connectivity status, for example, Manager's connectivity with its MDR peer
Place the mouse pointer over the
icon to view the description of the health check.
The
icon indicates that the health check is an advanced health check.
Run
Health checks are performed in the Manager only for those health checks that are enabled by selecting the checkboxes in the
Run column. By default, the checkboxes for default health checks are selected before running a health check for the first time.
Result
Displays the summary of the latest health check result
Notes
Displays any information in addition to the result summary that might be required, for example, when MDR is enabled, the check also displays the peer IP address and last synchronized time in the
Notes column.
Last Run
Displays the time stamp of the latest health check that was performed.
Example: Jul 03 12:14 GMT+05:30 2015.
Note
You can adjust the column width for any field by dragging the column line to customize the display of column width.
Click
Select Checks and select the health check options. The following are the available options.
Default (exclude advanced) - This option is selected by default. Standard checks are those checks that can run quickly, for example,
Manager Software Version and
Last Reboot.
All (include advanced) - This option is selected to include all checks, including advanced checks like
Delayed Alerts. Advanced checks take more time to execute and can possibly have an impact on the Manager performance.
Summary Only - This option selects only the summary checks which check on basic summary of the Manager's performance.
Database Checks Only - This option selects only database checks which check the database health.
Connectivity Checks Only - This option selects only connectivity checks which check the Manager's connectivity status.
None - This option is used to unselect all the selected health checks in the
Run column.
Click
Run Checks. The
Result,
Notes, and
Last Run columns display the health checks details.
Note
Running a health check might display an error if none of the checkboxes are enabled in the
Run column.
You can search and view a specific health check detail in the
Search text field. Type the first few letters of any detail in any column and the health check matching with the search criteria is filtered and displayed. For example, to search for health check on GTI Server connectivity, type
gti in the
Search text field.
The filtering is based on the values in the
Check,
Result, and
Notes columns. Apart from these filtering options, you can also filter based on the description given for each health check.
A green icon in the
Result column indicates that the check has passed. A red icon is a pointer that indicates that the check has failed.
Click
Save as CSV to save the health check result data in CSV format.
 icon to view the description of the health check.
 icon indicates that the health check is an advanced health check.