The Diagnostics Trace action uploads a device diagnostics log from a Sensor to your Manager server. The diagnostics file includes debug, log, and other information that can be used to determine device malfunctions or other performance issues. Once uploaded to your Manager, this file can be sent through email to Trellix Technical Support for analysis and troubleshooting advice.
Task
-
For a standalone Sensor, select
Devices → <Admin Domain Name> → Devices → <Device Name> → Troubleshooting → Diagnostics Trace.
For Sensors in a stack, select Devices → <Admin Domain Name> → Devices → <Device Name> → Member Sensors → <Stackname-node id> → Troubleshooting → Diagnostics Trace.
Diagnostics Trace page is displayed.Note
The <Device Name> refers to a Sensor.
Diagnostics Trace page 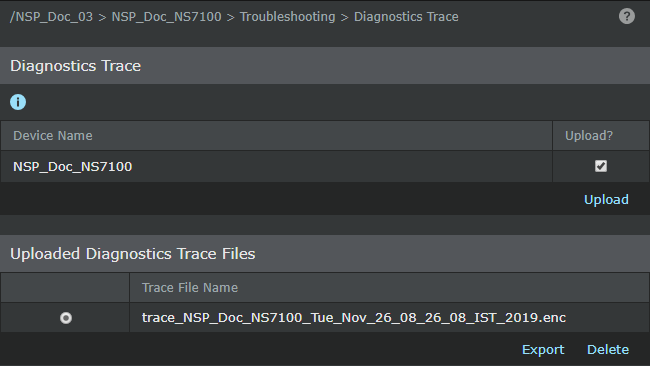
- Select the Upload? checkbox if it is not already selected.
-
Click
Upload.
The status appears in the Upload Diagnostics Status pop-up window.
- Click Close Window when the message DOWNLOAD COMPLETE appears. The trace file is saved to your Manager server at <Install_Dir>\temp\tftpin\<Device Name>\trace\. Once downloaded, the file also appears in the Uploaded Diagnostics Trace Files dialog box under this action.
- [Optional] Export a diagnostics file to a client machine by selecting the file from the Uploaded Diagnostics Files listed and clicking Export. Save this file to your client machine. Saving the file is particularly useful if you are logged in remotely, need to perform a diagnostics trace, and send the file to technical support.