Type
statusin the Sensor CLI.The status report appears.
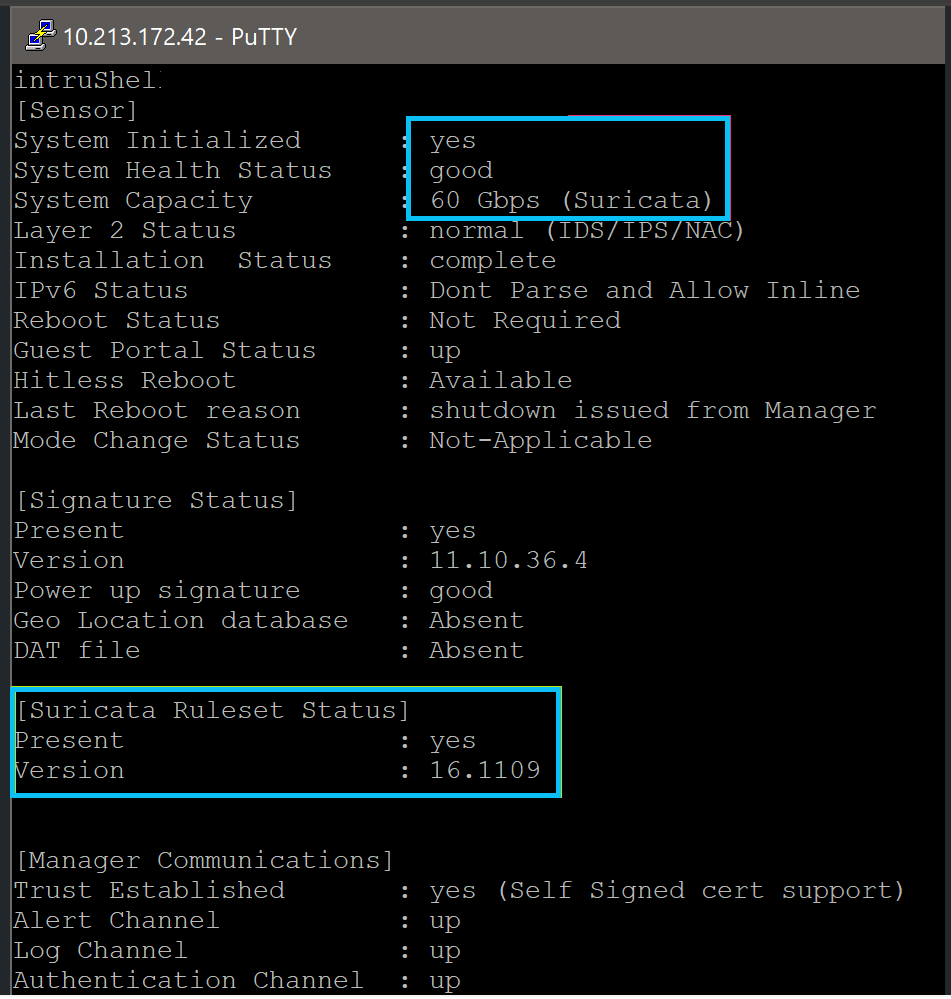
The Sensor parameter
System Initializedshould beyes, and for Manager communicationTrust Establishedshould beyes.Important
When the Sensor starts, the status is uninitialized. You must manually import and deploy the ruleset to the NS9600 Suricata Sensor. Run the
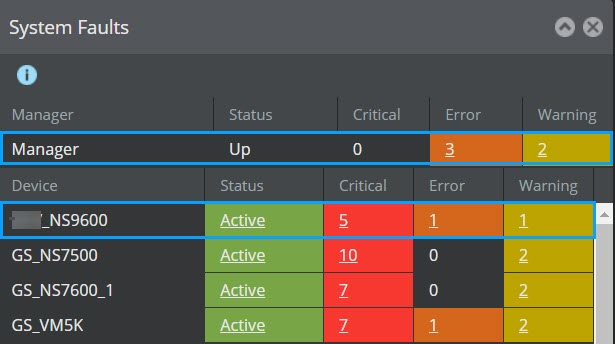
downloadstatuscommand to check the status.From the Manager Dashboard, view the Manager status in the System Faults monitor.
The Manager status displays as Up and Sensor status is Active.
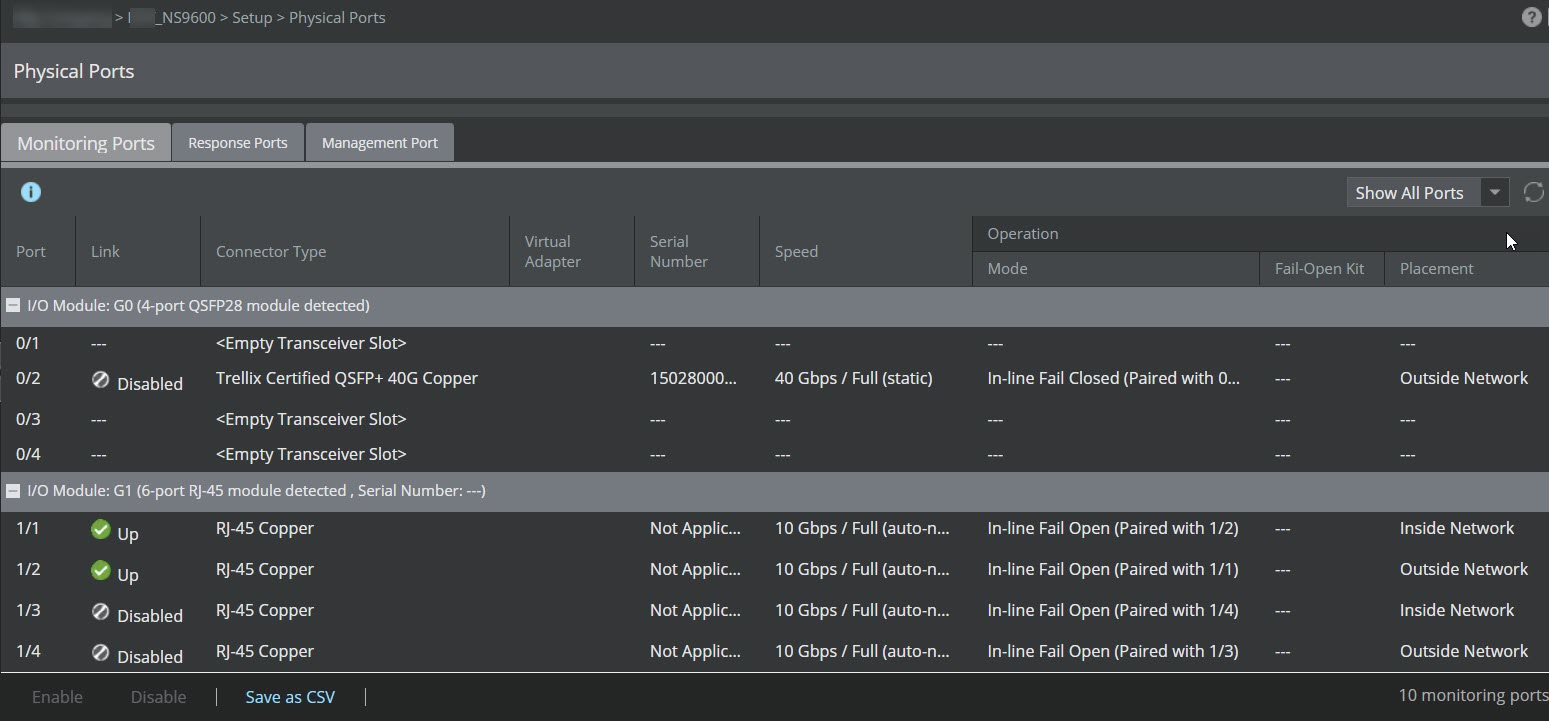
From the Manager, click Devices → <Admin Domain> → Devices → Setup → Physical Ports to view the port details of the standalone Sensor.
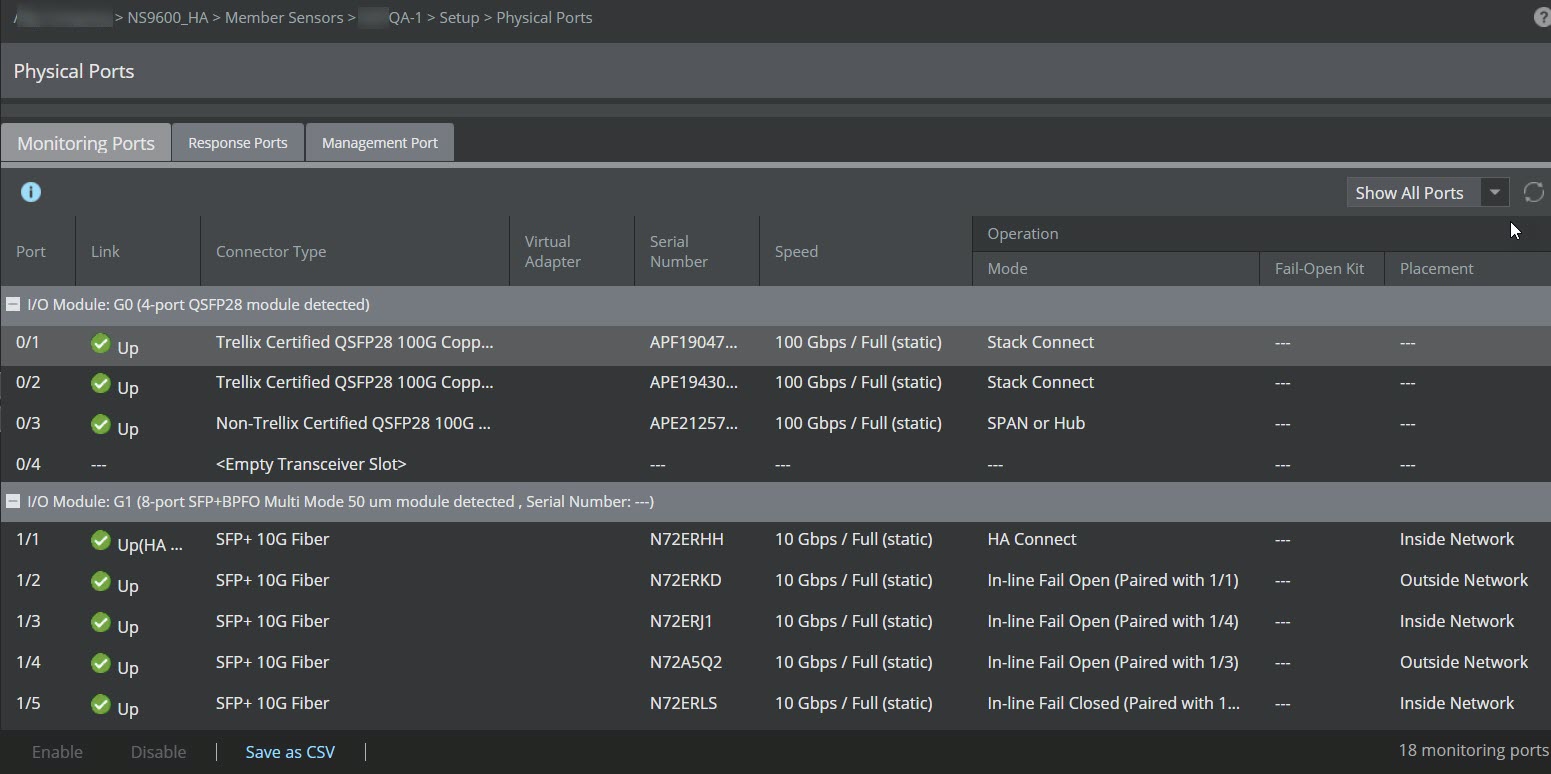
Click Devices → <Admin Domain Name> → Devices → <Device Name> → Member Sensors → <Stackname-Node ID> → Setup → Physical Ports to view the port details of a Sensor in a stack.
Important
If you have configured 100/40 Gigabit SR MTP/MPO or BiDi with internal fail-open network interface modules with the 100 Gbps speed and you want to reconfigure the speed to 40 Gbps, you may have to click Disable and then Enable the ports once or twice and refresh the Monitoring Ports tab to bring up the ports. This also applies to 100/40 Gigabit SR MTP/MPO interface module.
A policy named Default Prevention is active upon the addition of the Sensor. To view this policy, select Policy → <Admin Domain Name> → Intrusion Prevention → Policy Types → IPS.
The Default Prevention policy contains attacks already configured with a "blocking" Sensor response action. If any attack in the policy is triggered, the Sensor automatically blocks the attack. To tune this or any other Trellix-provided policies, you can clone the policy and then customize it as described in Trellix Intrusion Prevention System Product Guide.
Verify successful installation
- Published on Sep 17, 2026
- 1 minute(s) read
Was this article helpful?