Use this file to discover all available pages before exploring further.
The new docs.trellix.com features a modernized UI and AI-powered conversational search. Content is currently available in English, with additional languages expected in early November 2026. We hope you enjoy the updated experience.
Sensor performance statistics can be viewed in the
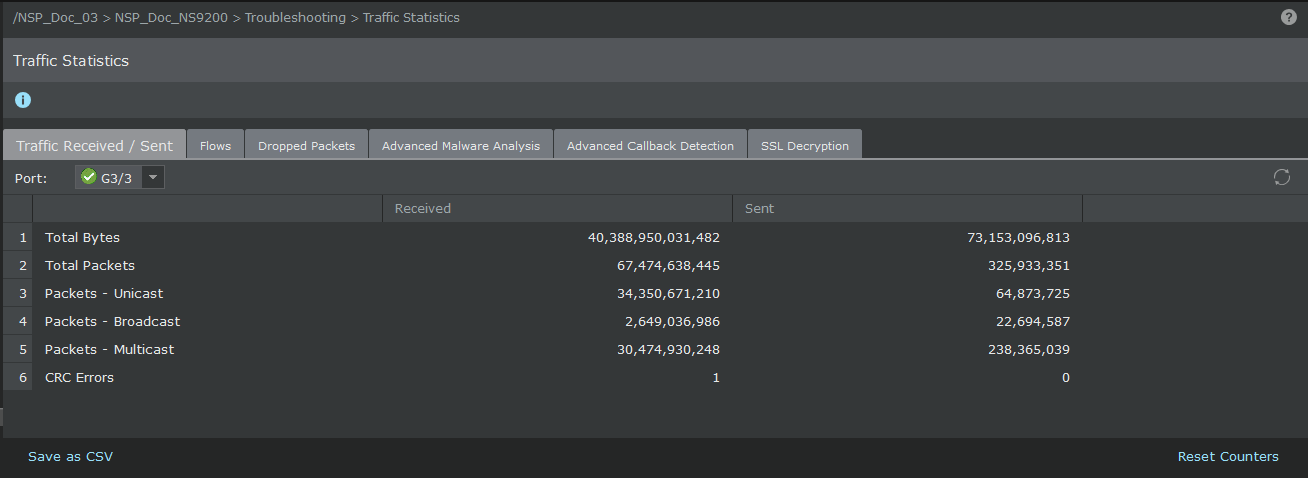
Traffic Statistics page that displays different type of Sensor statistics. The list of options available for Sensor performance statistics are:
Traffic Received / Sent — Statistics of the total number of packets received (Rx) and transmitted (Tx) for a given device
Flows — Statistical view of the TCP and UDP flow data processed by a device. Checking your flow rates can help you determine if your device is processing traffic normally, while providing you with a view of statistics, such as the maximum number of flows supported as well as the number of active TCP and UDP flows.
Dropped Packets — Packet drop rate on a port
Advanced Malware Analysis — Statistics of the malware detected for a given device
Advanced Callback Detection — Statistics on the amount of callback activity and communication attempts to the C&C servers
Rate Limiting — Rate limiting statistics provides the estimated number of packets dropped/bytes dropped by the device. You can view rate limiting statistics for each device (per port), listed in the resource tree of Manager.
Follow this procedure to view Sensor performance statistics (this example demonstrates steps for creating Flow statistics):
Task
Navigate to
Devices → <Admin Domain Name> → Devices → Device Name → Troubleshooting → Traffic Statistics.
Select the
Traffic Received / Sent tab.
Traffic Received / Sent statistics Click the refresh icon to refresh the data for the port selected.