Details about the Cluster are available in the Manager.
Steps:
In the Manager, go to Devices → <Admin Domain Name> → Devices → <Cluster> → Summary.
The device Summary page is displayed.
Summary details of a GWLB cluster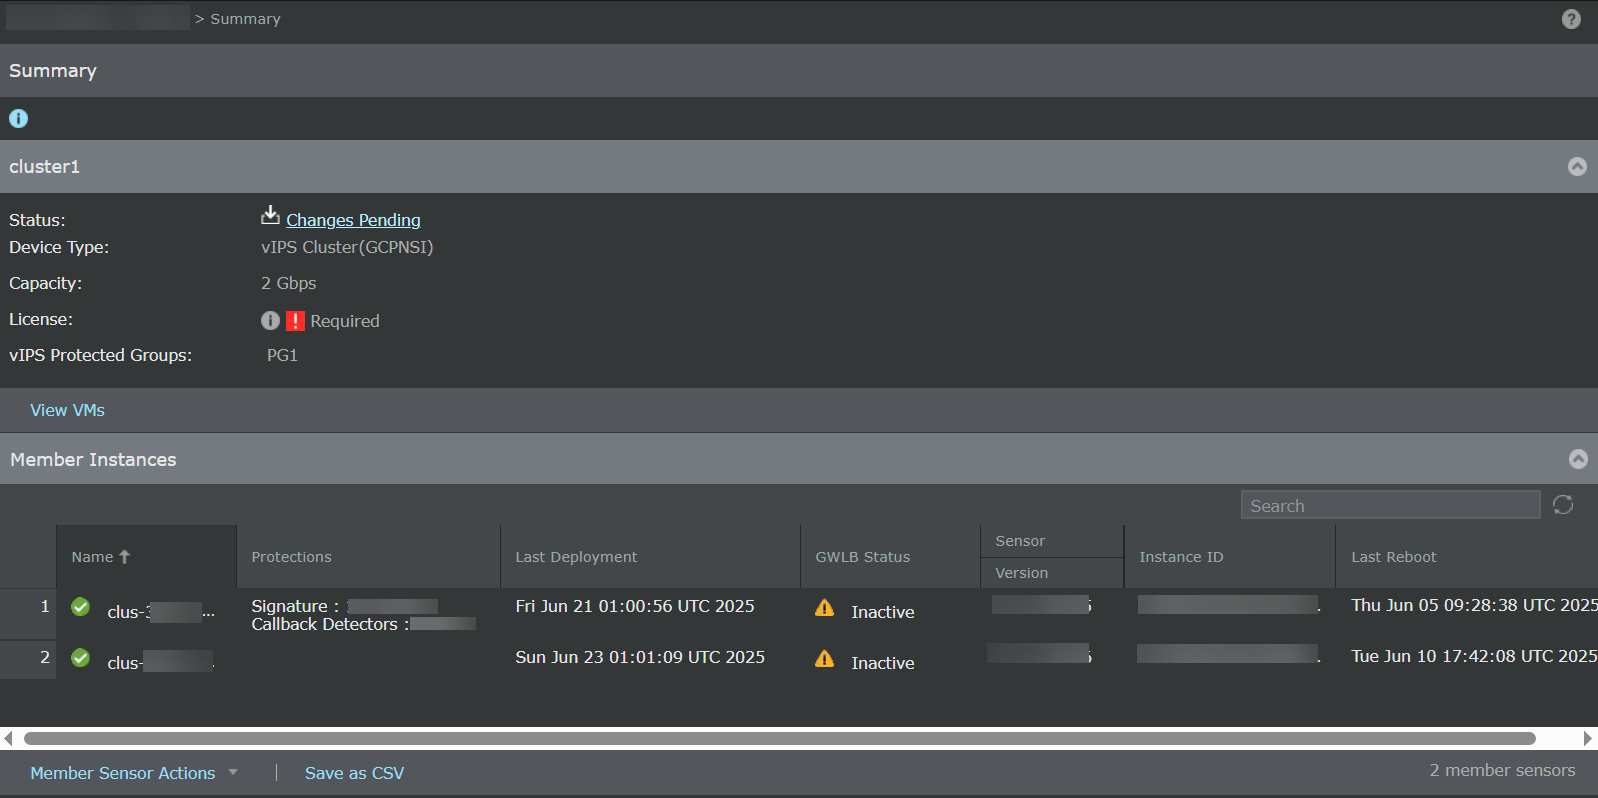 Option definitions
Option
Definition
Status
Displays whether there are pending changes to be deployed to the virtual security system or if it is up to date. Green indicates that the system is up to date and blue indicates that there are pending changes to be deployed.
Device Type
The type of device, for example, Cluster (GWLB Mirroring)
Trellix Virtual IPS Controller
Displays the status of the Controller
Capacity
Displays the total capacity of the license required for a device
License
Displays the license(s) status of the device
vIPS Protected Groups
Displays the name of the vIPS Protected Group
Member Instances
Name
Displays the status and name of the instance
Protections
Displays the Software, Signature set, and Callback Detector versions of the Sensor
Last Deployment
The timestamp of previously deployed pending changes
Sensor
Version - Displays the version of the Sensor
Instance ID
Displays the ID of the Controller
Last Reboot
Displays the time stamp of the last reboot performed
To restart the Sensor, click Member Sensor Actions → Reboot.
To view the traffic statistics, click Member Sensor Actions → Traffic Statistics.
To run a diagnostic trace for the Sensor, click Member Sensor Actions → Run diagnostics.
To export the Sensor software information in the form of a .csv file, click Save as CSV.