Task
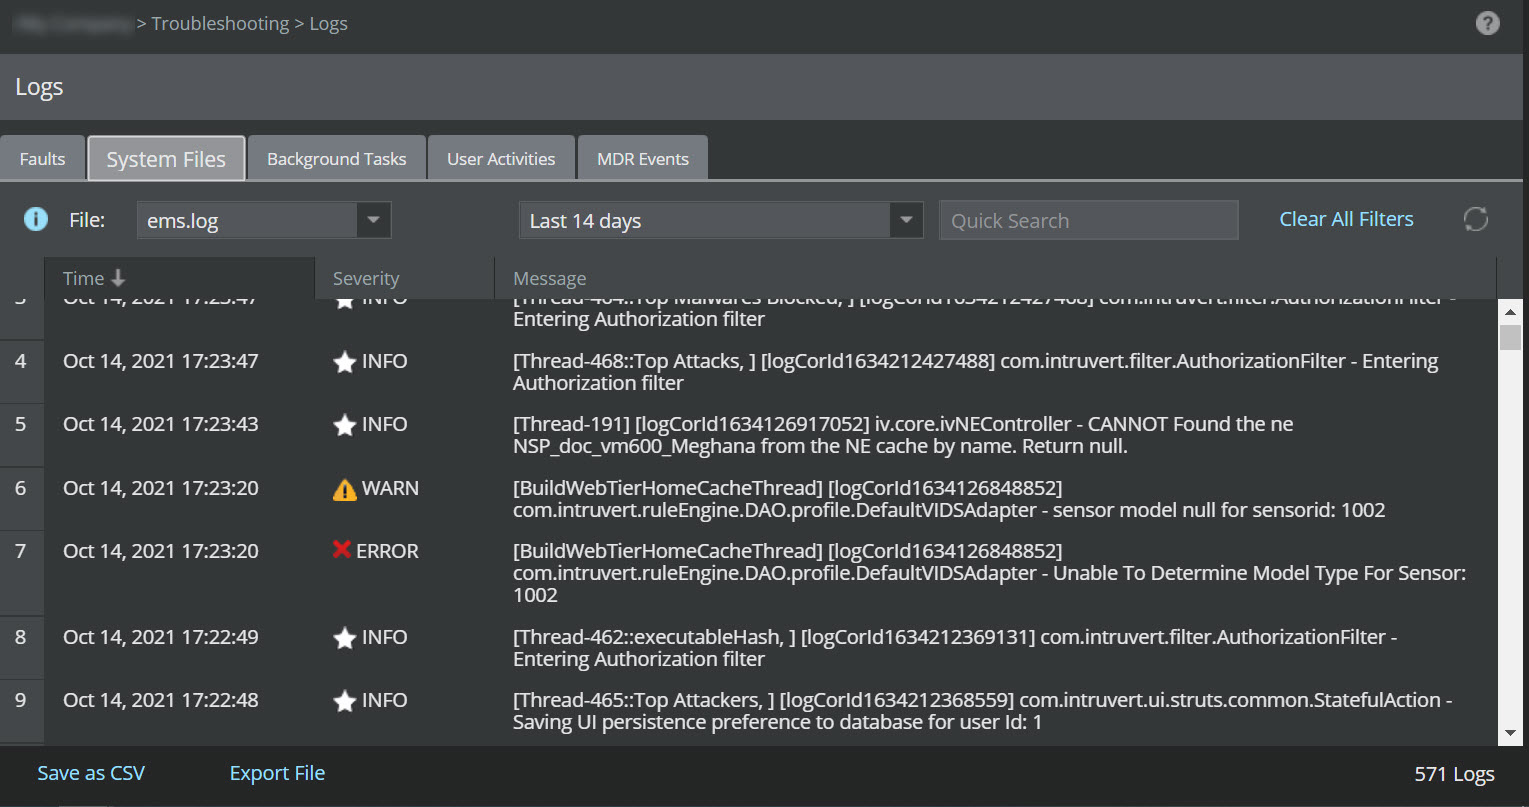
- Go to Manager → <Admin Domain Name> → Troubleshooting → Logs and select System Files tab.
- Select a File from the drop-down list.
-
The
System Files table is displayed with logs for the selected file type.
Note
The maximum number of logs displayed in any system file is 50,000.
The following is table lists the information displayed in the System Files table:
Column Description Time Displays date and time of event occurrence. Severity Displays severity of the event. The different severity levels are as follows:
- ALL— All actions performed/recorded by the system.
- DEBUG— Only debug information for the system.
- INFO— Only configuration information, such as when an action is performed.
- WARN— Only system warning (medium severity) information.
- ERROR— Only system error (high severity) information.
- FATAL— Only crash/failure information.
Message Displays the following information for the activity. - Status— Displays the status of the activity. The activity will be in Successful, Failed, or In-progress state.
- Category— Displays category of the activity.
- Summary— Displays brief summary on nature of the activity.