The DoS profiles show a comparative display of short-term and long-term distribution for the selected profile.
Task
- Click the Devices tab.
- Select the domain from the Domain drop-down list.
- In the left pane, click the Devices tab.
- Select the device from the Device drop-down list.
-
Select
Troubleshooting → Denial of Service → Profiles.
The Dos Profiles page details the current status of DoS learning mode policies applied to an interface or sub-interface. DoS policy was inherited from the domain upon Sensor addition but might have changed due to the application of a different policy at the interface or sub-interface level.
DoS Profiles tab 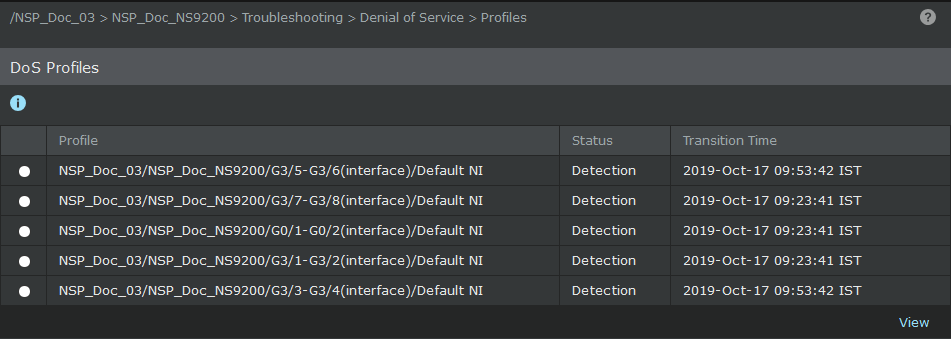
Option definitions Option Definition Profile The sub-interface or VLAN/CIDR ID where a DoS profile was applied. Default NI refers to all traffic that is not a part of an interface subdivision, that is, sub-interface, VLAN tag, or CIDR block. Status Lists whether the profile is currently learning or detecting. Learning means the profile baseline is being built. Detection means the learning profile has finished and traffic is being checked against the baseline. Transition Time The exact time when the learning profile started analysis or when the active detection for the learning profile began. The Status field indicates which process is currently operating. -
Select a DoS profile and click
View.
DoS profile - Advanced Scanning 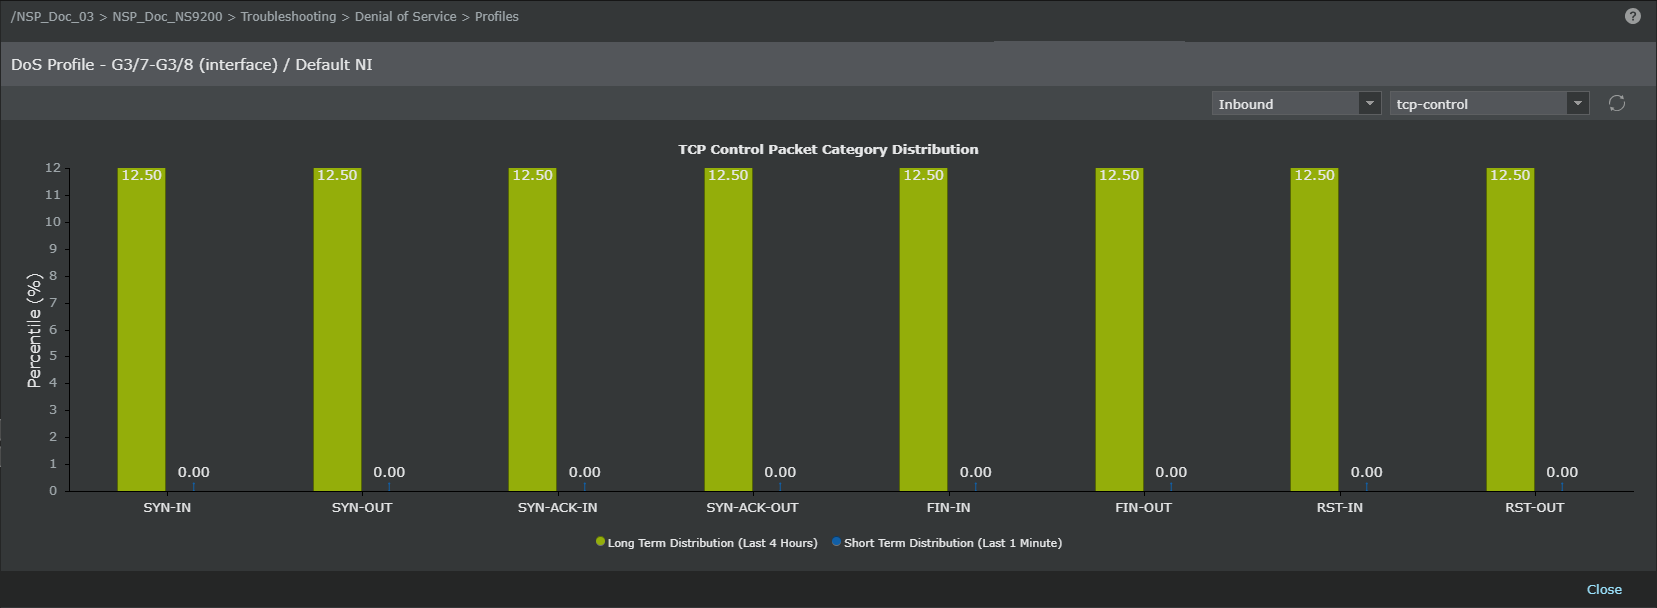
-
Optionally, select the direction (Example: Inbound) and a measure (example: tcp-control) to display rate data for the measures in the DoS profile applied to the selected interface.
When reading the chart, it is helpful to remember that:
- The long-term profile is the compilation of the short-term profiles.
- The horizontal axis contains buckets of the various packet rates.
- The vertical axis indicates the percentage of those rates falling into each bucket.
- Click Close to go back to the DoS Profiles page.