Use the following methods to view Network Security HA status and health information.
Red notification bell
 at the top right corner of the Web UI.
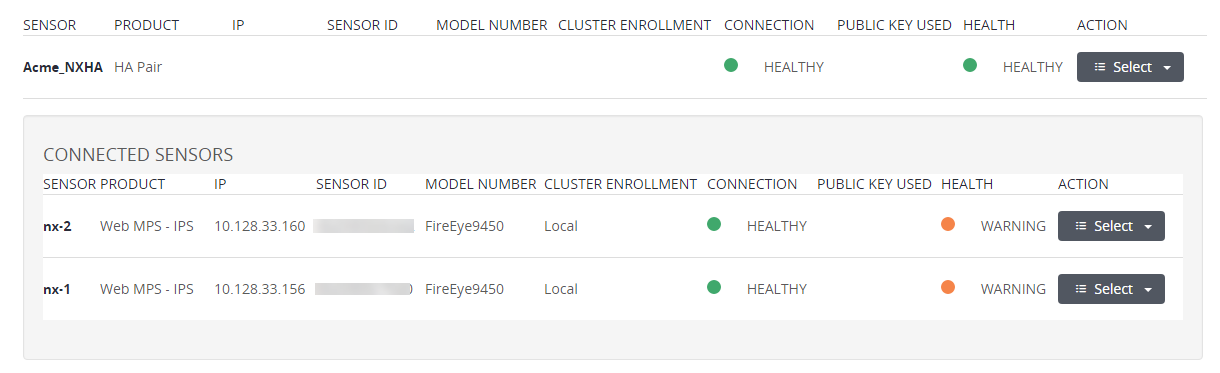
Appliances > Sensors page in the Central Management System Web UI
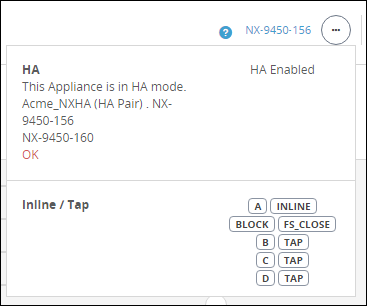
HA Enabled control in the Network Security Web UI
Log in to the Central Management System or Network Security Web UI.
Click the bell at the top right of the Web UI window. The notifications are listed in a popup window that opens.
Note
The bell shown above indicates that there is one notification. The bell is not displayed when there are no notifications.
Central Management System notifications include:
CRITICAL: NX-HA "Acme_NXHA" needs immediate attention. One or more configuration settings don't match.
WARNING: NX-HA "Acme_NXHA" is in a degraded state. Security content versions don't match.
Network Security notifications include:
Data port link is down.
Control port link is down.
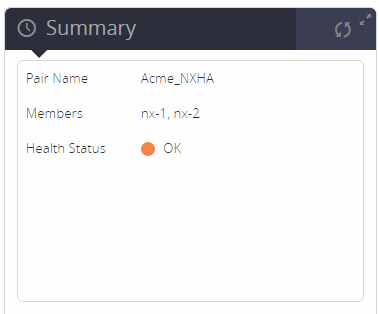
Log in to the Central Management System Web UI.
At the top right of the panel, select the pair from the drop-down menu.
For example:
Log in to the Central Management System Web UI.
Select Appliances > Sensors.
Locate the HA pair.
Click the pair name in the Sensor column to view detailed information about each appliance in the pair.
Note
The HA pair status is shown in the row for the pair. The information in the rows for the members of the pair pertains specifically to each appliance, not to the pair. However, the problems reported in those rows could affect the health of the pair. For information about the appliance health, see the Central Management System Administration Guide.
If a Sync config with link is present, hover over the
 icon to determine which configuration settings do not match.
Note
See Configuration synchronization for information about synchronizing the appliance configurations.
For example:

Log in to the Network Security Web UI.
Click the user icon
 at the top right of the main window.
For example: