You can add a filter of your choice. This is specially useful if you are unable to find a specific attribute in the security tables. To add a filter of your choice:
- From the Domain drop-down list in the left pane, select the root admin domain.
- Click
 .
.
- Enter the values in the following fields:
- Filter On — Select a core attribute from the drop-down list.
- Value — Choose the specific value from the drop-down list. You need to enter the specific values for the Attacker IP, target IP, and Malware.
Add Filter Criterion dialog 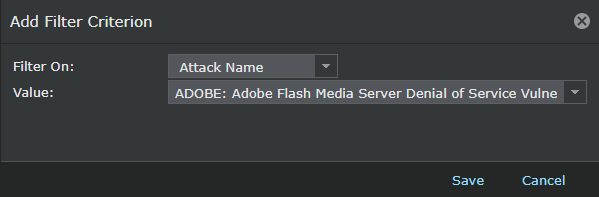
Note
- On the Dashboard page, if you click a hyperlink on any security monitor, you are directed to the Threat Explorer page with the core attribute and admin domain already set. You can then choose to add more filter criteria. Example: A click in the Top Attackers security monitor displays the TE page with the core attribute Attacker IP address, for example, 10.1.1.15 and My Company already set.
- If you click on the attack details in the Top Attacker Countries and the Top Target Countries monitors, you are redirected to the Attack Log page with the filter attribute for the Country already set.
- Click
Save. The refreshed page provides details for further analysis. For the preceding example, you can view the Attacker IP details like endpoint information.
Note
You can select the time duration and network flow from the options in the right hand corner.
Attacker IP details 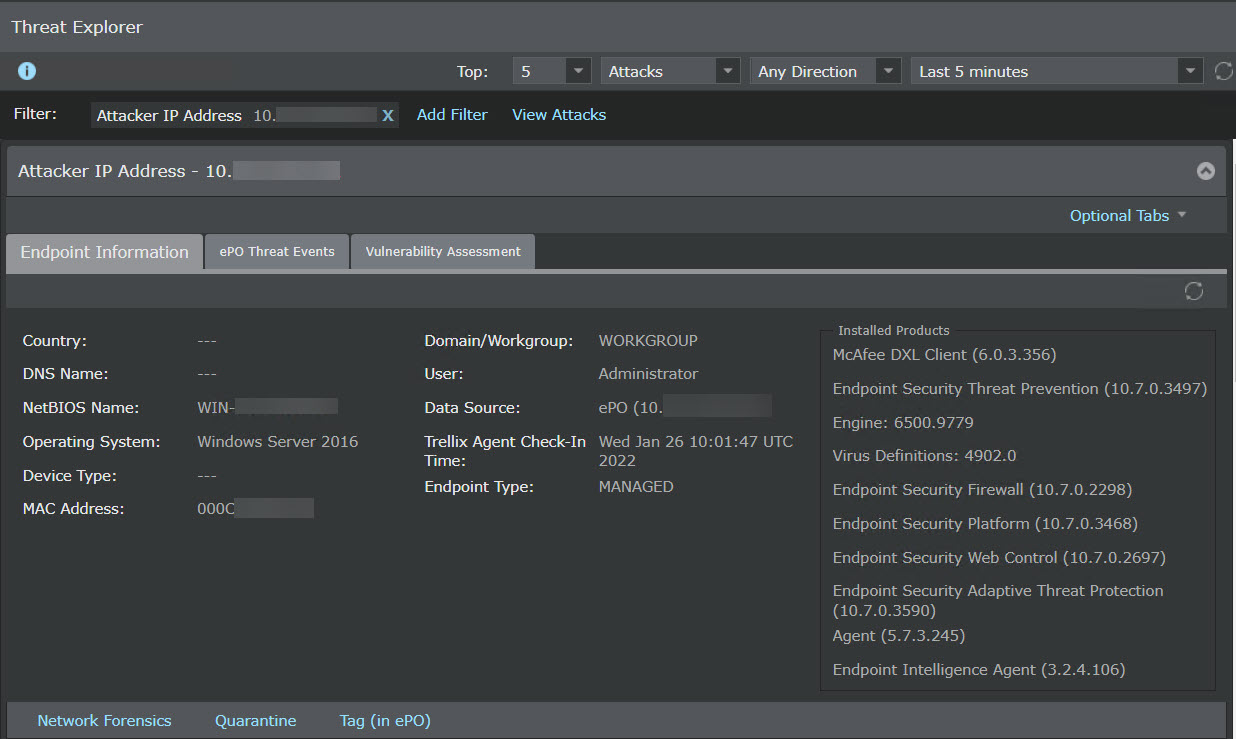
- View the details. Now you want to investigate details from a data source, for example, 10.1.1.12 and
My Company as the admin domain. Set a secondary filter. To do this, click
Add Filter and select this IP. The refreshed page displays details based on both primary and secondary filters applied.
Remember
If you remove the primary filter, the secondary filter becomes the primary criterion and vice-versa.
Data source details 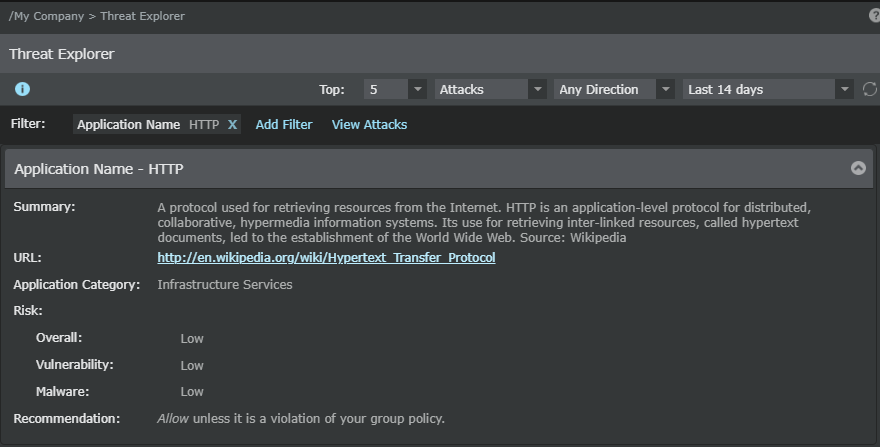
- Click
Network Forensics → Analyze to analyze this endpoint's recent behavior in the network. You can view details like ETF, client and server connections to this endpoint, and data source.
Network forensics .png)
- Click View Attacks and select the option to investigate this IP address as an attacker or target. The Attack Log page displays details about this IP address.
Note
(Optional) You can view the endpoint threat events (ePO Threat Events) and vulnerabilities if the Manager is integrated with Trellix ePolicy Orchestrator - On-prem and McAfee Vulnerability Manager.