On a Network Security sensor or sensor-enabled Network Security integrated appliance, the sensor extracts the suspicious or malicious objects and URLs that need to be analyzed by the MVX cluster. The Intelligent Virtual Execution - Server compute node returns the results of the analysis over the SSH connection to the sensor. You can view the results of the analysis on the Alerts > Alerts > Alerts page, Alerts > Alerts > Hosts page, or the Alerts > Alerts > Callback Activity page in the Network Security sensor Web UI.
Detailed incidents and alerts are generated by the Network Security MVX analysis and detection engines.
During a Web browsing session, a compromised website might load an advertisement that redirects the user’s browser to an exploit site. From this site, the browser downloads malicious mobile code to the user’s laptop or workstation. The malicious code is designed to allow the attacker to take control of the user’s device. This is command and control (CnC) of a device by malware to access sensitive information and corporate documents. The CnC code typically involves callback to a command and control server. The malware can also compromise other assets in the enterprise network when accessed by other corporate users.
Every Web-based malware event is detected by Network Security either as a new infection or as a subsequent callback from the initial MVX engine victim machine as well as from other infected corporate users’ machines. The results of Network Security MVX engine detection are displayed on the Alerts pages with links for malware results specific to Hosts, Alerts, and Callback Activity. The SC Version column displays the version number of the security content that was in use when the event occurred.
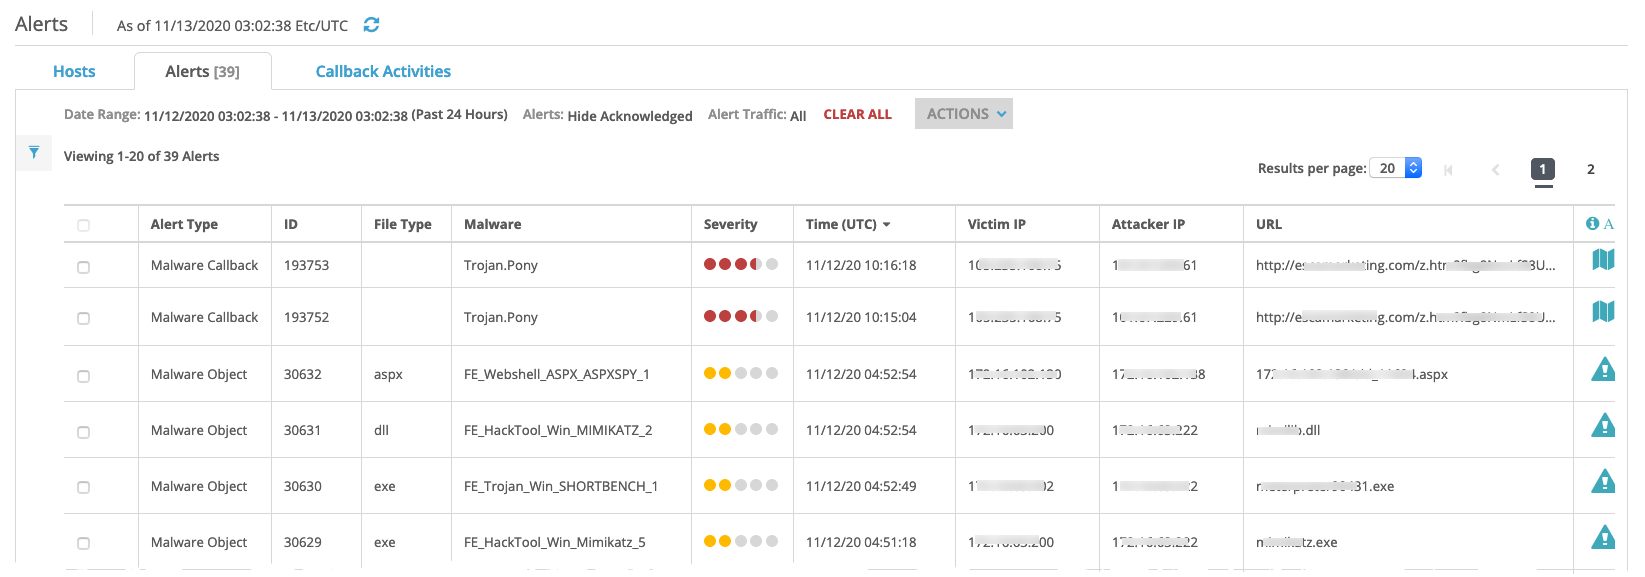
Click Alerts (located at the top of the table) to view the status of each alert in the Alerts page, as shown in the following figure. Analysts can filter, sort, and search for alert types.
Note
Only the top-level row information is searchable.
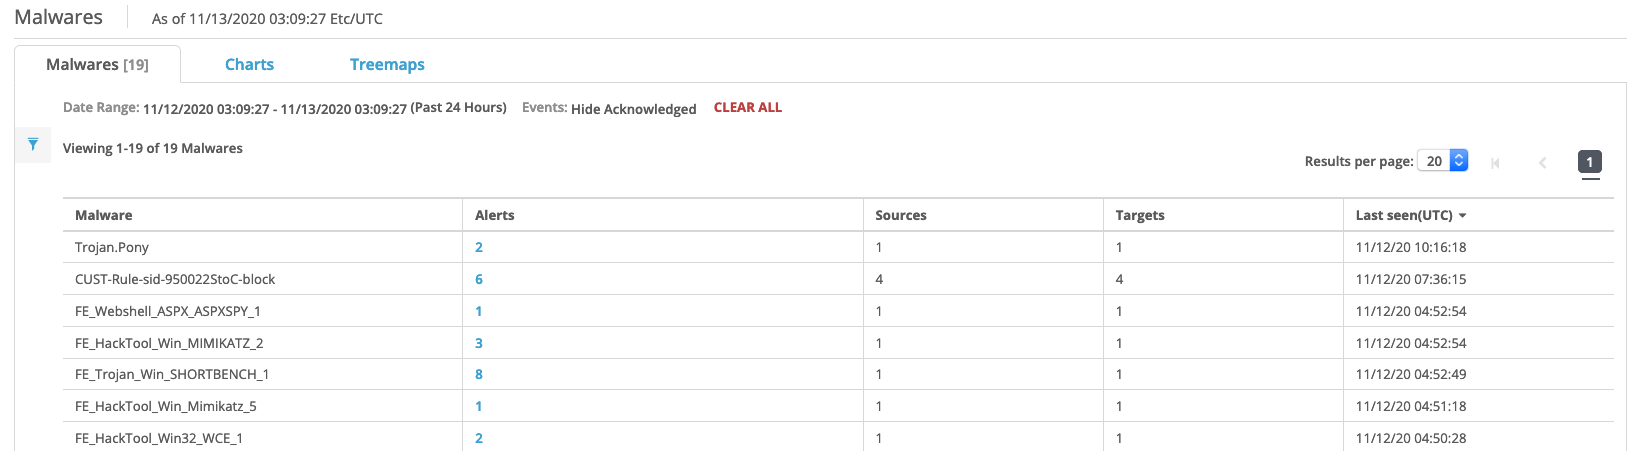
Click Summaries to view additional charts or tables of aggregated Alert results, as shown in the following figure.
Click Dashboard to view a collection of panels that provide a high-level summary of threat intelligence provided by the Network Security appliance. For details about the Web UI Dashboard, see the Network Security System Administration Guide.