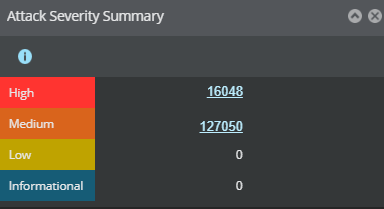
The Attack Severity Summary section of the Dashboard page displays statistics for the unacknowledged faults in the logged-in domain. Faults are categorized by system impact Severity level: High, Medium, Low, and Informational.
Note
When all the Managers managed by the Central Manager are using version 10.1, the Attack Severity Summary monitor will display alerts. If any Manager version is less than 10.1, the Attack Severity Summary monitor will not display alerts. You must manually hide the Attack Severity Summary monitor using Dashboard Settings dialog. For more information on hiding a monitor see Dashboard Settings Dashboard Settings.