The Faults tab page displays messages that are generated to detail the system faults experienced by Trellix IPS.
To view the faults, follow the steps below:
Task
-
Go to
Manager → <Admin Domain Name> → Troubleshooting → Logs and select
Faults tab to view the system faults.
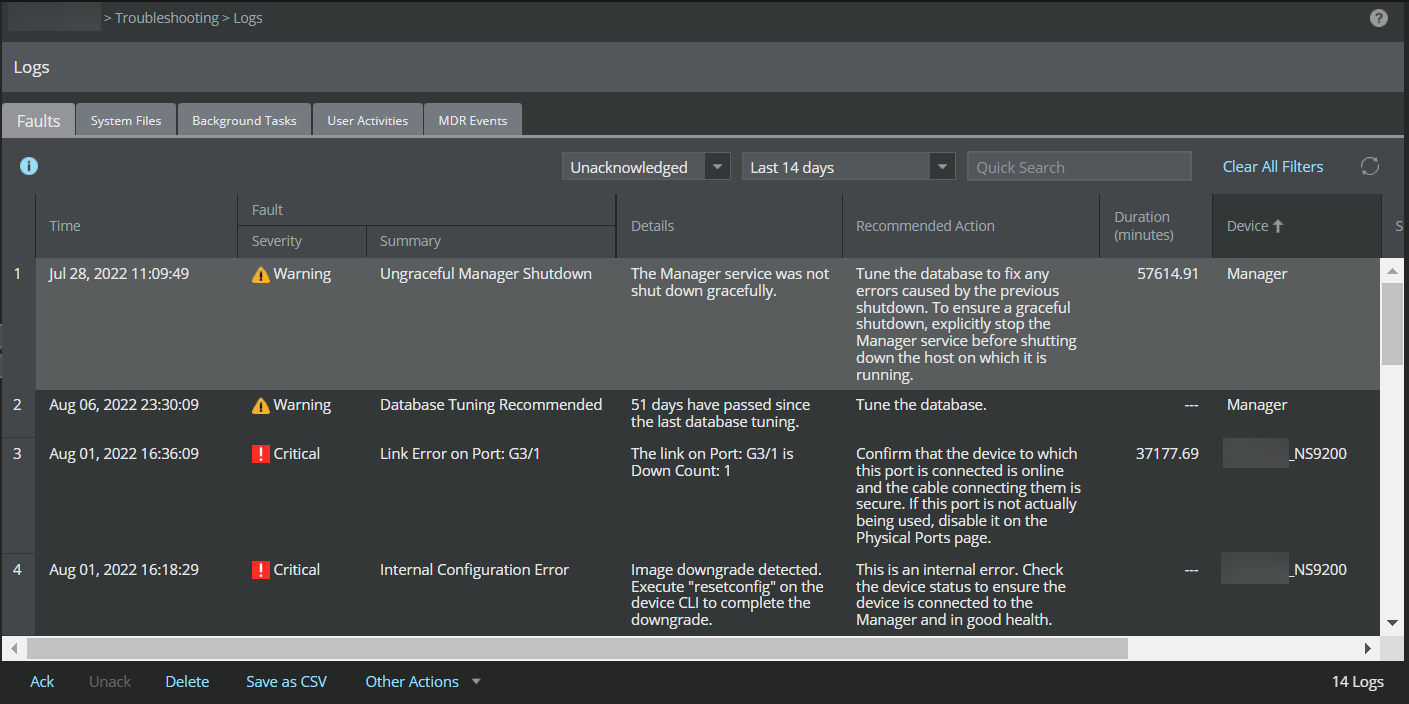
The data displayed in the table is based on the time frame of the core attribute in the faults table. By default, the logs for last 7 days are displayed. The data can be filtered for the time period of your preference using the Custom Time Period option.The following table lists the fields on the Faults tab:
Options Definition 
Displays when a fault is acknowledged Note
By default, acknowledge column is hidden.
Time Displays date and time of fault occurrence Fault Displays severity and summary of the activity - Severity: Displays severity level of the activity.
Different severity levels are as follows:
- Informational
- Warning
- Error
- Critical
- Summary: Displays brief summary of the activity
Details Displays brief report on nature of the activity Recommended Actions Displays the action to be performed to remediate the faults Duration Displays the time length of fault condition Note
The Duration option is not applicable for all faults.
Device Displays the device name for which the fault is generated Note
For Central Manager, the Manager name is displayed for which fault is generated.
- Severity: Displays severity level of the activity.
-
You can save a copy of faults by clicking
Save as CSV.
Note
The Save as CSV option saves a copy of system faults based on the filters applied. To save a copy of all system faults, clear all filters before saving it as Save as CSV.