The Manager → <Admin Domain Name> → Troubleshooting → Logs (Manager → Troubleshooting → Logs in case of Central Manager) option enables a privileged user to view information like faults, system files, background tasks, user activities, and MDR events. The information displayed in the Logs page are from different log files available in the Manager database, thus providing a beneficial resource for analysis and/or problem-solving.
The different tabs available in the Logs page are as follows:
- Faults: Displays system faults information
- System Files: Displays system logs information based on user activity or general system information
- Background Tasks: Displays status of long running processes in your system
- User Activities: Displays all user actions in the Manager
- MDR Events: Displays previous MDR activities
Filter logs
You can filter logs based on the period in which the logs were generated. The Custom Time Period option lets you customize the time period. When the time period option is selected, the logs are displayed for the chosen time period. By default, the logs for last 7 days are displayed.
When looking for a particular log, you can enter the keyword for the log in the Quick Search field and the results are automatically displayed in the log. Click Clear All Filters to undo all filters applied. The button color and the column header color changes to orange which indicates that a filter is active, and that the particular logs tab is not displaying all entries.
The entries in different tabs of the Logs page are not refreshed automatically. Use the refresh icon to view new logs generated. Use the arrow keys at the bottom of the page to navigate back and forth between the pages in a tab.
Sort, group, and filter logs
The tabs in the Logs page display thousands of log items and it consumes time to search for specific type of log item. To enable you to find a particular log item, the sorting, grouping, and filtering feature is available for each tab in the Logs page. Using this feature you can group and filter the logs based on specific fields and sort the logs in ascending or descending order.
The different options available in each column are as follows:
| Options | Definition |
|---|---|
| Sort Ascending | Sorts the logs table in ascending order with the column header as core attribute |
| Sort Descending | Sorts the logs table in descending order with the column header as core attribute |
| Columns | Allows you to select the columns to be displayed on a particular tab |
| Group by this field | Allows you to consolidate and view a group of log entries based on specific fields in the column for a particular tab. For more information about how to group the log entries, refer to
View grouped logs.
|
| Filters | Allows you to apply filters to specific columns on a tab
|
View grouped logs
You can consolidate and view a group of logs based on specific fields on each tab of the Logs page. To view a consolidated group of logs, perform the following steps:
- Select Manager → <Admin Domain Name> → Troubleshooting → Logs.
- In the Logs page, select the tab you want to view a group of logs for.
- Click the arrow in the triangular icon in the column header of the field by which you want to group the logs and select
Group by this field.
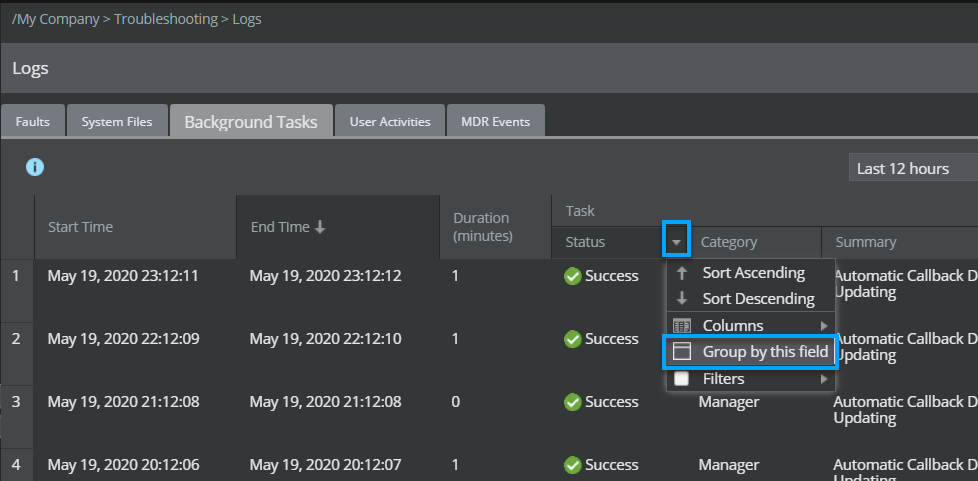
A window is displayed for the selected field. For example, if you select the Group by this field option for the Status field, the Group By Task Status window is displayed.
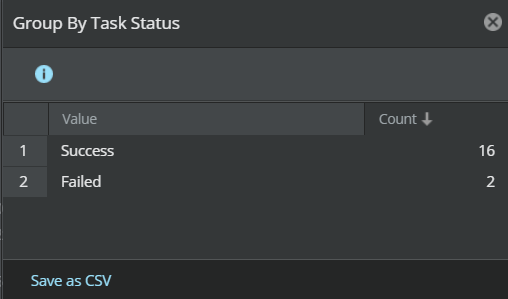
The following options are available in the Group By <field name> window.
Option Definition Value Displays the list of items available for the selected field. For example, the Group By Task Status window displays the following items: - Success
- Failed
Count Displays the total count of the logs for each group Save as CSV Saves a copy of the list of items available and the total count for the selected field You can further sort the logs in Group By <field name> window by sorting the columns in ascending or descending order.
- In the window, double-click on the row of the item you want to view the grouped logs for. The window closes and the grouped logs are displayed in the
Logs page.
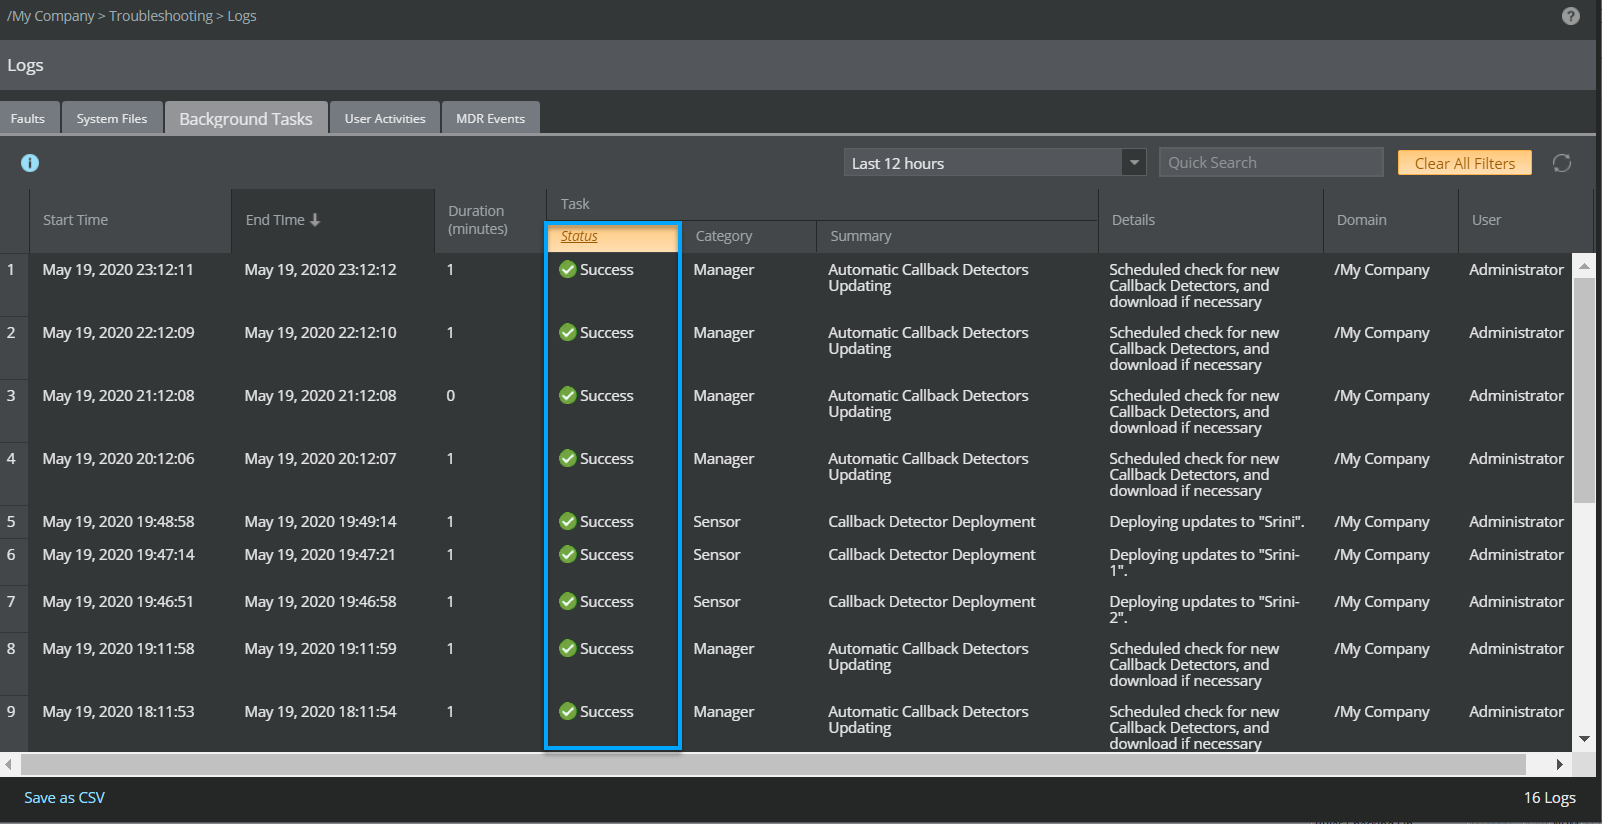
Note
The column header color changes to orange, which indicates that the logs are grouped by that option and only those logs are displayed in this page.
In this example, after grouping the logs, you can further group them to the next level of grouping by selecting the Group by this field option on any other column header where this option is available. For example, after grouping the logs based on Success from the Status field in the Task column, you can further filter the group based on Sensor from the Category field in the Task column. As a result, the Logs page displays only those logs which have Status as Success and Category as Sensor.
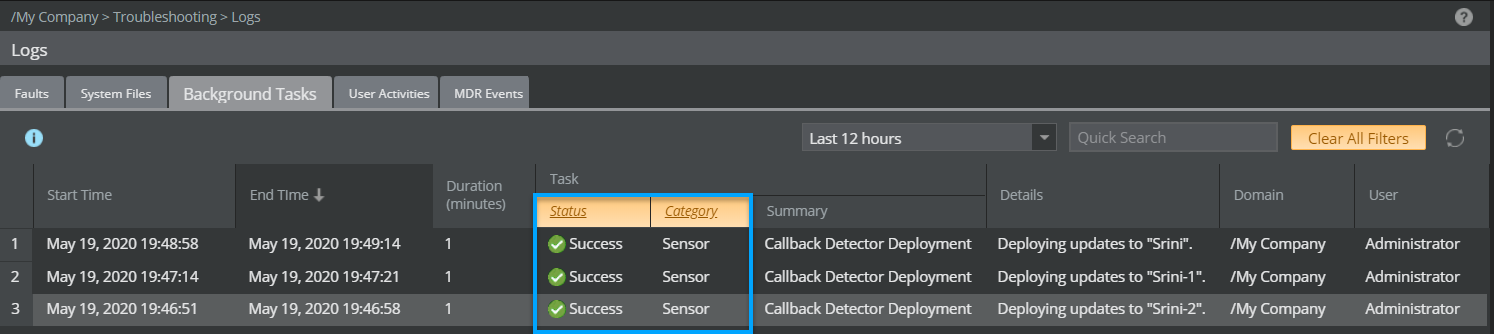 To remove the filtering of grouped logs, click Clear All Filters.
Logs can be grouped by all fields in the Logs page, except for the following columns:
- Faults: Time, Summary under Faults column, Details, Recommended Action, and Duration
- System Files: Time and Message
- Background Tasks: Start Time, End Time, Duration (Minutes), and Details
- User Activities: Time and Details
- MDR Events: Time and Details