You can monitor thresholds from the Manager Dashboard pages.
Task
-
Click the numbers listed against the device to be monitored under the warnings column of the
System Faults monitor.
System Faults monitor 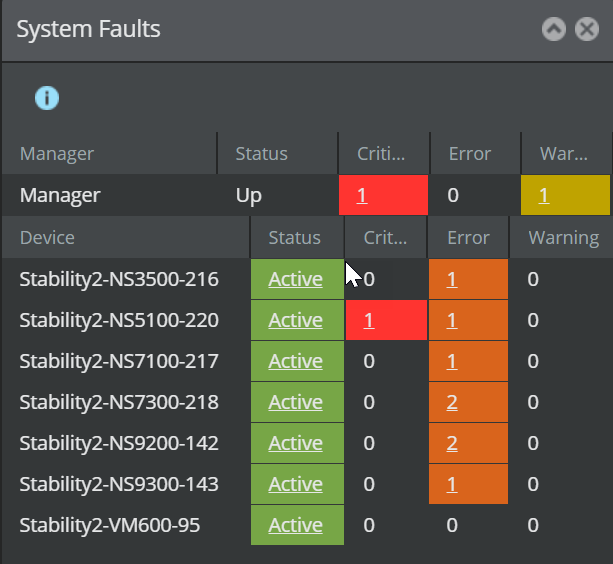
-
The
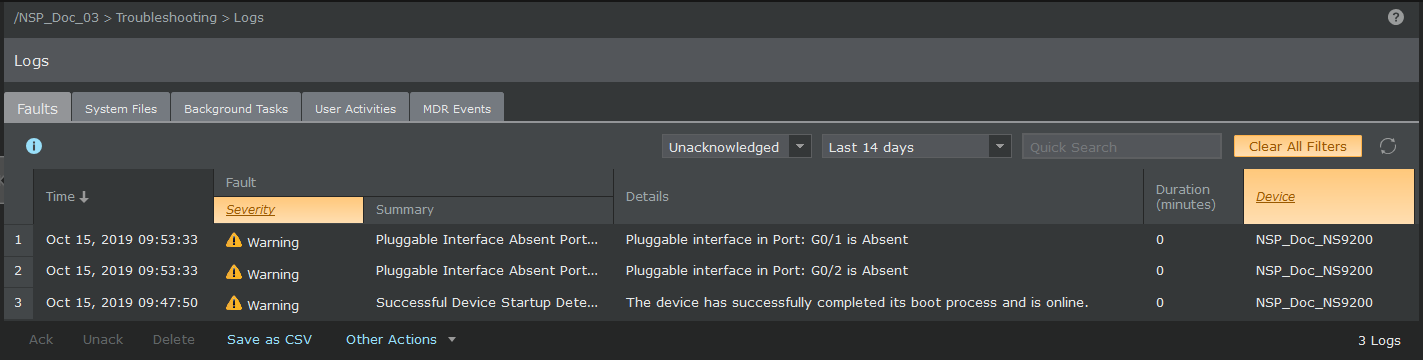
Faults tab in the
Logs page displays the list of warnings for the selected device.
The warnings relating to the Sensor performance monitoring thresholds are listed as a Device Performance - Memory Usage - System Memory fault type.
Warning dialog