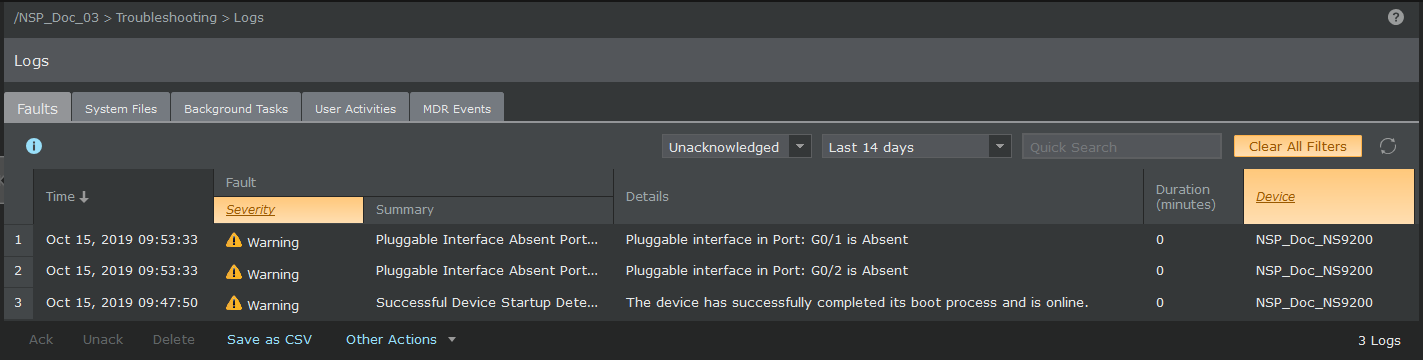
To view Monitoring thresholds:
Task
-
Select
Manager → <Admin Domain Name> → Troubleshooting → Logs and select
Faults tab.
The Faults tab displays the Operational Status of the Manager, Database, and Sensors.
Note
The numbers listed are in "Unacknowledged Fault Count / Total Fault Count" format.
-
In the Device pane, click on the total listed under the
Warning column to view all warnings.
The warnings relating to the Sensor performance monitoring thresholds are listed as a Device Performance - Memory Usage - System Memory fault type.
Fault Count page