This section provides instructions about monitoring malware and callback activity using the Web UI.
Click Alerts to view the Alerts page. Click Hosts to display a list of infected hosts. Click Callback Activity to display a list of CnC servers.
For all pages under the Alerts > Alerts tab (Hosts, Alerts, and Callback Activity), the Events filter in the Filters panel can be set to view the following events:
Set Hide Acknowledged to show information about unacknowledged events only.
Select Show Acknowledged to show information about acknowledged events only.
Select All to view both unacknowledged events and acknowledged events.
Acknowledged alerts are identified by a blue bar on the right side of the Host field.
Navigation tasks for malware and callback activity
Task | Steps to Complete |
|---|---|
Filter on a column value | Open the Filters panel. In the column you want to search, type the text you want to match and then press Enter. The list displays only the items that match the column-specific criteria you entered. When you filter the Alerts > Hosts view on a string in the "Last Malware" column, the system checks all malware (not just the most recent malware) seen on every infected host within selected time frame. |
Navigate additional information or event pages | Click the applicable number in the relevant column. Or click the arrow (located at the first column). |
Navigate event pages | Click the arrow to display the next page. Up to 20 pages are shown. Or use the following keyboard shortcuts:
|
Change the view filter | Click the Date Range drop-down list. |
Sort by column | Click a column header. |
Show or hide events that were previously acknowledged by an administrator. | Click the search icon on the far left to display Filters. Expand Alerts or Events and select either Show Acknowledged or Hide Acknowledged from the drop-down list. |
Show only major and critical detections. | Click the search icon on the far left to display Filters, expand Critical Detection and select the Show Critical Detections checkbox. |
Change the page or tab | Click the orange text on the gray navigation bar. |
Expand an inline details pane to see the infection and malware callback events associated with the host or callback activity. | Click the orange arrow to the left of each host. To close the details pane, click the orange triangle again. |
View specific events | Click a red number. Click the arrow on the left side of the event to expand the Filtered Events page. Click the red pcap link to access packet captures associated with the event. For forensics or confirmation, click the text link next to the pcap link to decode the pcap data and present it in a browser window or tab, which you can also open the packet capture using a packet analyzer, such as Wireshark. |
Access theTrellix Malware Intelligence Lab portal | Click a malware link. A new browser window displays additional information about the attack type. |
Export a PDF file of the results. | Click Print PDF at the top right-side of the page. The PDF file contains only the content that is visible on the page. For example, if an item on the page is not expanded, the details about that item are displayed and will not be included in the PDF output. To export a PDF, expand the sections to show the information you want to capture. Choose the processing time as standard, extra, or heavy. The default processing time is standard. |
Viewing alerts and monitor activity
In the Web UI, choose Alerts > Alerts > Alerts.
The Alerts page appears.
Click one of the following links at the top of the table:
Callback Activity
Hosts
Viewing callback activity details
In the Web UI, choose Alerts > Alerts > Callback Activity.
The Callback Activity page appears.
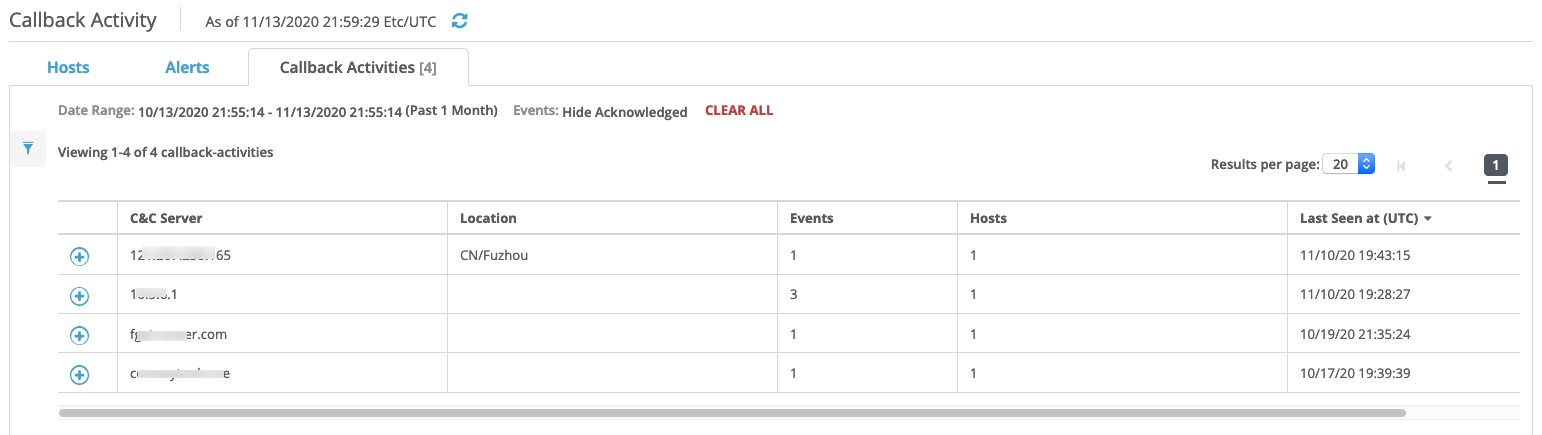
To view detailed information, click the arrow to the left of a CnC server.
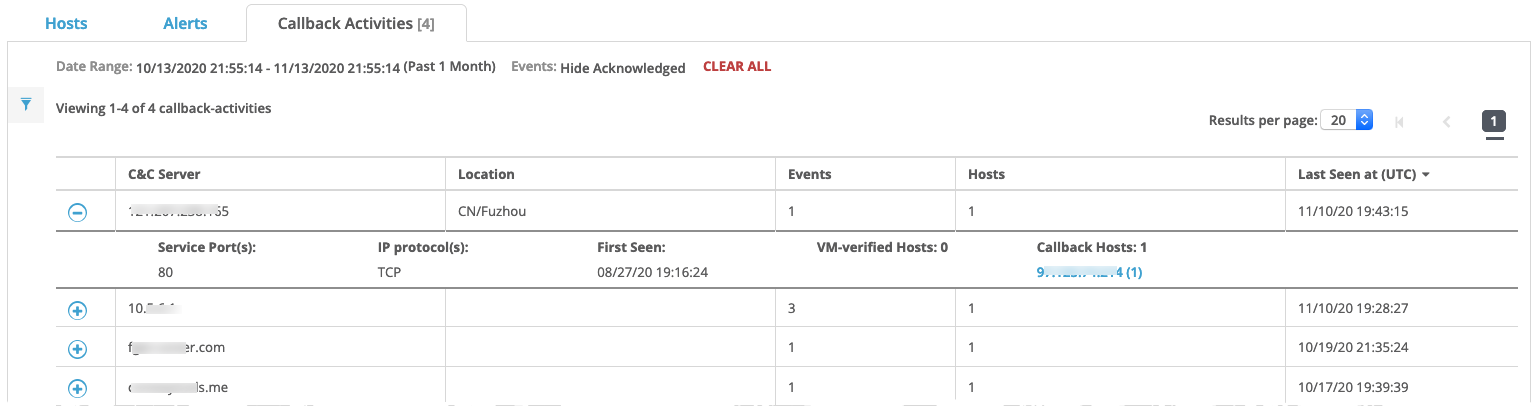
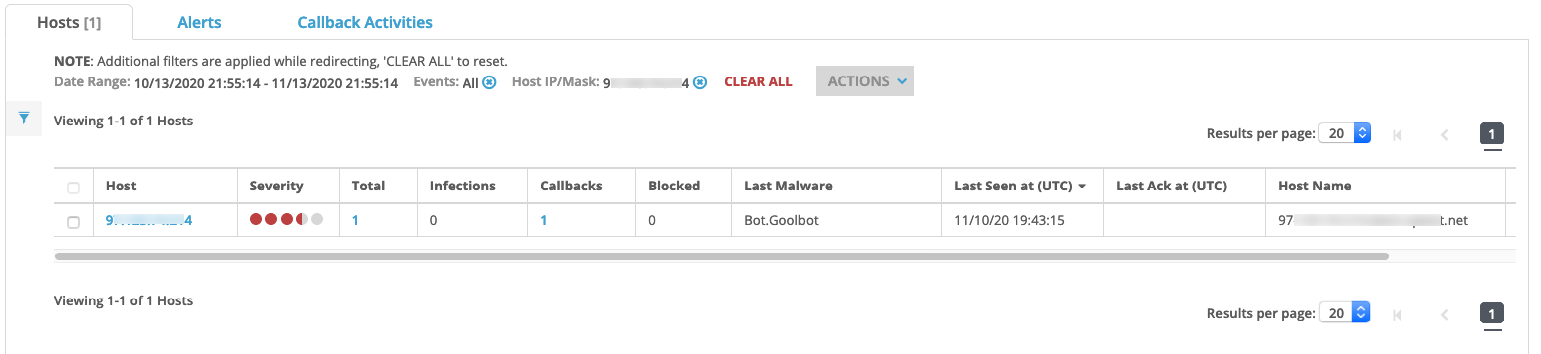
To view the infected hosts, click the IP address or hostname link.
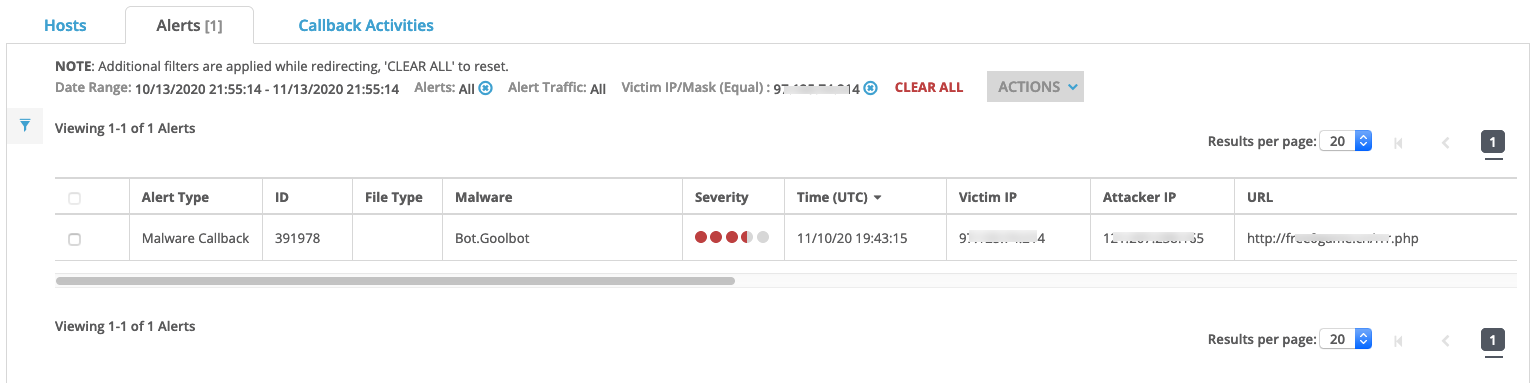
To view the associated events, click the numeric link.
Field descriptions for callback activity
Field | Description |
|---|---|
C&C Server | Name or IP address of the server that directs the callback activity. |
Location | Geographic location of the server, if known. This column is displayed only if geo-location data is loaded. |
Events | Number of events associated with the CnC server. |
Hosts | Number of hosts on the monitored network that have been verified as botnet zombies under the control of the CnC server. |
Last seen at | Date and time of the last event, reported in the local time zone. |
Viewing analysis results and alerts
Malware events are organized by the following infection types:
Malware Object
Malware Callback
Domain Match
Infection Match
Web Infection
In the Web UI, choose Alerts > Alerts > Hosts.
The Hosts page displays.
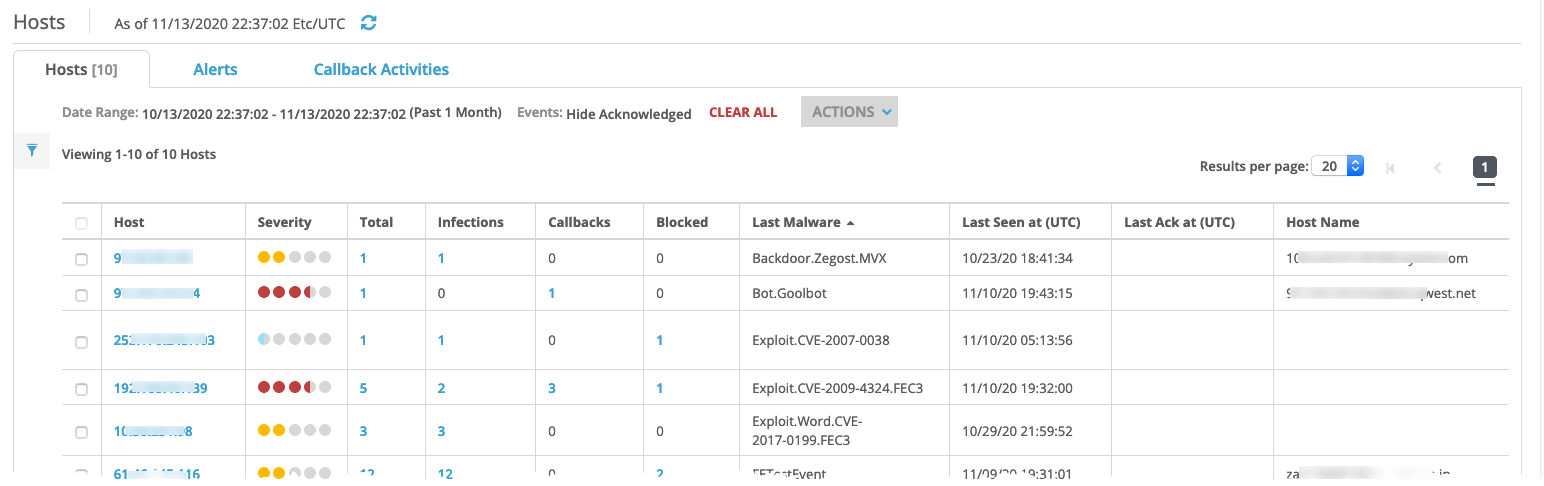
To view detailed information about the infections on a host, click the Host IP address.
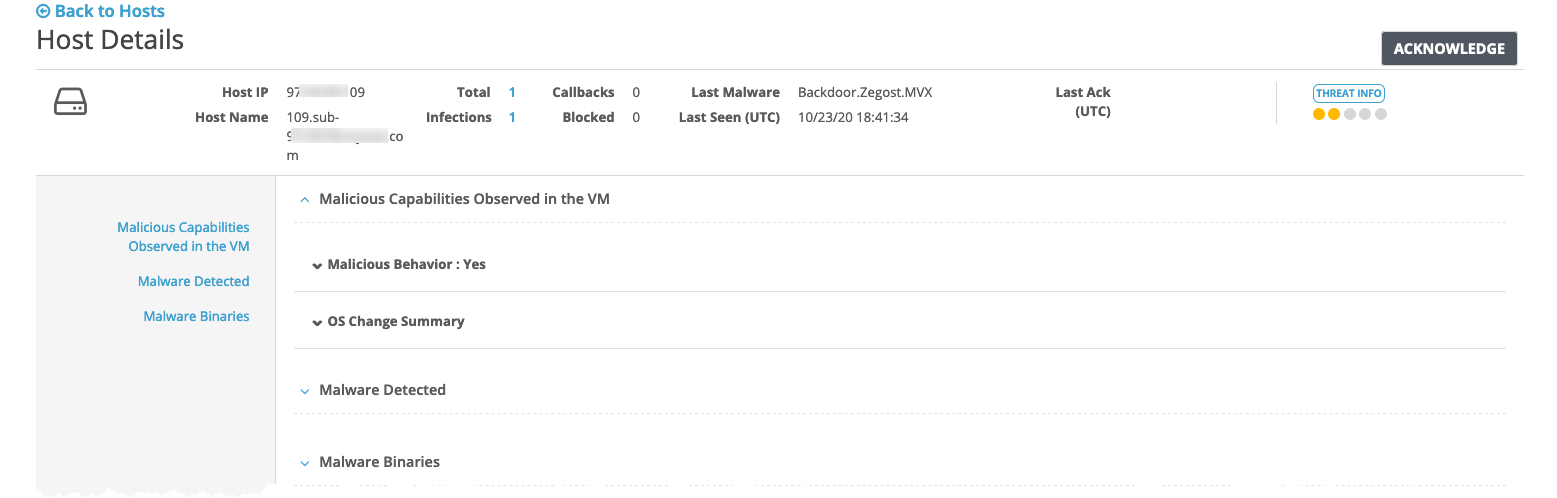
Each section in the Host Details screen can also be expanded.
To view the associated events, click the number in the relevant column.
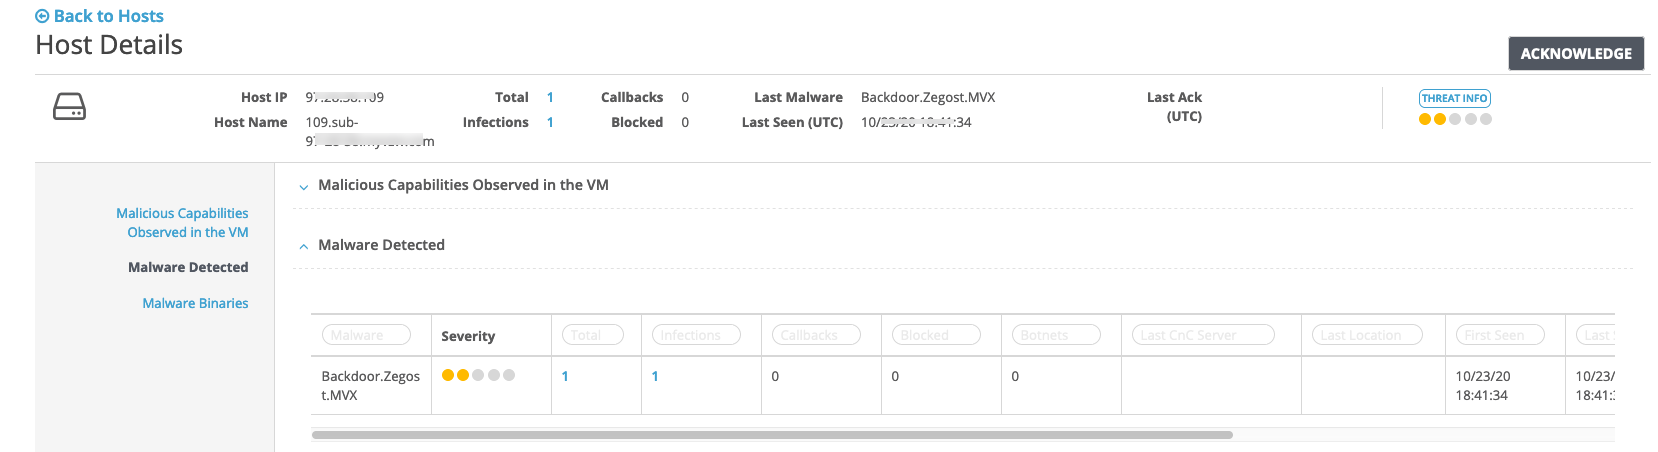
Field descriptions for infected host alerts
Field | Description |
|---|---|
Host | IP address of the infected host. |
Severity | Visual representation of the severity of the infection. |
Total | Number of malware events for this host. Click a number to view more details about the events. |
Infections | Number of infections for this host including callbacks. |
Callbacks | Number of malware callback infections for this host. These infection types include signature matches and communications with the botnet server. |
Blocked | Number of events that were blocked by appliance inline blocking. |
Last Malware | Type of malware that is involved in the infection. |
Last seen at | Date and time of the last attack on the host. |
Last ack at | Time of the last acknowledgment. Notes that were entered when the host's events were acknowledged. Acknowledged events are removed from the lists on the Dashboard page, Alerts page, and Summaries page. Click the search icon on the far left to display Filters. Expand Alerts or Events and select Show Acknowledged from the drop-down list. |
Host Name | Last hostname that is associated with the specified IP address, if known. |
Malicious Capabilities Observed in the VM (MVX engine) | |
Data Theft | Number of items that were stolen or targeted for theft. For details about the Data Theft badge, see Data theft badge in the Web UI. |
Malicious Behavior | Type of malware activity observed. |
OS Change Summary | Operating system changes made by the malware. |
Malware detected | |
Malware | Type of malware that is involved in the infection. Click the links for information about the malware types. |
Severity | Severity level of the event. |
Total | Number of alerts for the specified malware family. Click the links to view alerts about all the malware events on that host from the same malware family. |
Infections | Number of infections confirmed on the MVX engine. |
Callbacks | Number of events that involved communication with a remote command and control (CnC) server. |
Blocked | Number of events that were blocked by appliance inline blocking. Click Settings or Alerts to configure blocking action. |
Botnets | Number of events that involve botnets. |
Last CnC Server | IP address of the remote CnC server. |
Last Location | CnC server location, if known. |
First Seen | First time that an infection event was recorded. |
Last Seen | Last time that an infection event was recorded. |
Ports Used | Port number that is used in the attack. |
Protocols | Protocol that is used in the attack. |
Infections URL | |
Initial Infection URL | List of the first 10 URLs that infected the victim. Click the arrow to the left of a URL to display the URLs that the user was directed to as a result of the infection. The original (first) URL that was visited is shown in bold. The full listing includes:
|
# Visits | Number of times the infected host has visited the same infection URL. |
Total URLs | Total number of URLs involved in the infection. |
First URL at | Time that the first URL was reached. |
Last URL at | Time that the last URL was reached. |
Malware Binaries | |
Md5sum | Result of checksum. The protocol headers can be expanded. |
Protocol | Protocol that is involved. |
Encoding | Encoding that is used. |
Last analysis time | Time when the most recent checksum was performed. |
# Occurrences | Number of checksum activities. |
Field Descriptions for Filtered Events
Malware events can be viewed or searched by Host, Alert ID, or Callback Activity.
Note
If the Network Security appliance is configured for inline operation, and if the numeric link is a callback, the Filtered Events detail displays the blocking action that was taken.
Field | Description |
|---|---|
Traffic Details | Packet capture (or pcap) data. View pcap data directly using a packet analyzer application or in a browser window by clicking the text link. |
Analysis Details | The malware name, analysis OS, match type, interface, checksum, and the blocking action if the appliance is configured for inline operation. |
Bot Communication Details | Servers, ports, commands, and other communication details. |
Infection URLs | The suspect URLs associated with the event. Click the icon under DL to download a hexadecimal trace file. |
OS Change Detail | Changes to the operating system associated with the event. |
Callback communication from infected host | The infected server and commands involved in the event. |
Callback communication observed from the MVX engine | Response that is reported from the MVX engines. |
Attempted infection communication | Infection that is provided matching information. |
Acknowledging events
When you acknowledge an event that has been viewed or analyzed, the event is deleted from the Alerts table. To display the event again, use the Show Acknowledged option.
In the Web UI, click Alerts.
The Alerts page displays.
Click the search icon on the far left to display Filters.
Expand Events and select Hide Acknowledged from the drop-down list checkbox.
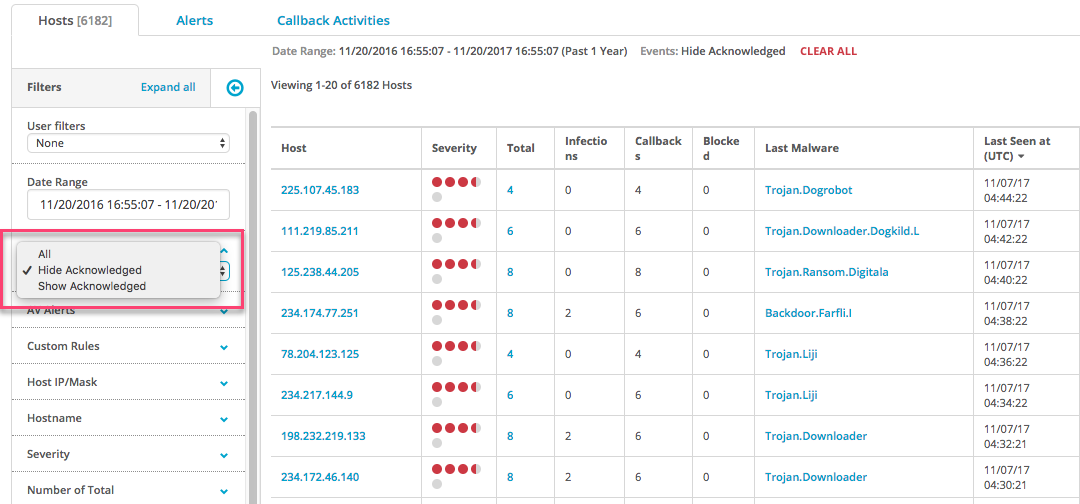
The event is deleted from the Hosts list.
Click the search icon on the far left to display Filters.
Expand Events and select Show Acknowledged from the drop-down list checkbox.
The event is added to the list with a highlighted color, and the reason for the acknowledgment is displayed in the Last Ack column.
Viewing Critical detections
Major and critical alerts include the Web Infection, Malware Object, and Malware Callback alert types.
In the Web UI, click Alerts.
The Alerts page appears.
Click the Alerts link (located at the top of the table).
Click the search icon on the far left to display Filters.
To display only major and critical detections, open the Alerts filter and select the Show Critical Detections checkbox.