The Network Anomalies feature provides a complete view of connections between attackers and victims within a network using force-directed charts. This feature is useful for tracing a particular IP address or Domain and its involvement with other nodes of the network and to analyse victim/attacker behaviour.
The anomalies trend chart and events details helps in examining important event attributes like Bytes_in, Bytes_out, Inbound_md, outbound_mb etc.
Viewing Network Anomalies using the Web UI
Network Anomalies can be found on the Alerts > Network Anomalies page. The page has the following features:
Date Range: Use the date range drop-down and buttons to view the Events Trend graph for a selected period.
Filter Icon: Click the Filter icon to view all the filter options.
List of victims and attackers: The panel on the left has two separate tabs for lists of victims and attackers. Use the drop-down list to sort the IP addresses or domains by number of attackers or victims or number of events.
Events Trend Graph: The Events Trend graph shows network anomalies for a selected date range. Adjacent to the graph, you can view the total number of events and attackers.
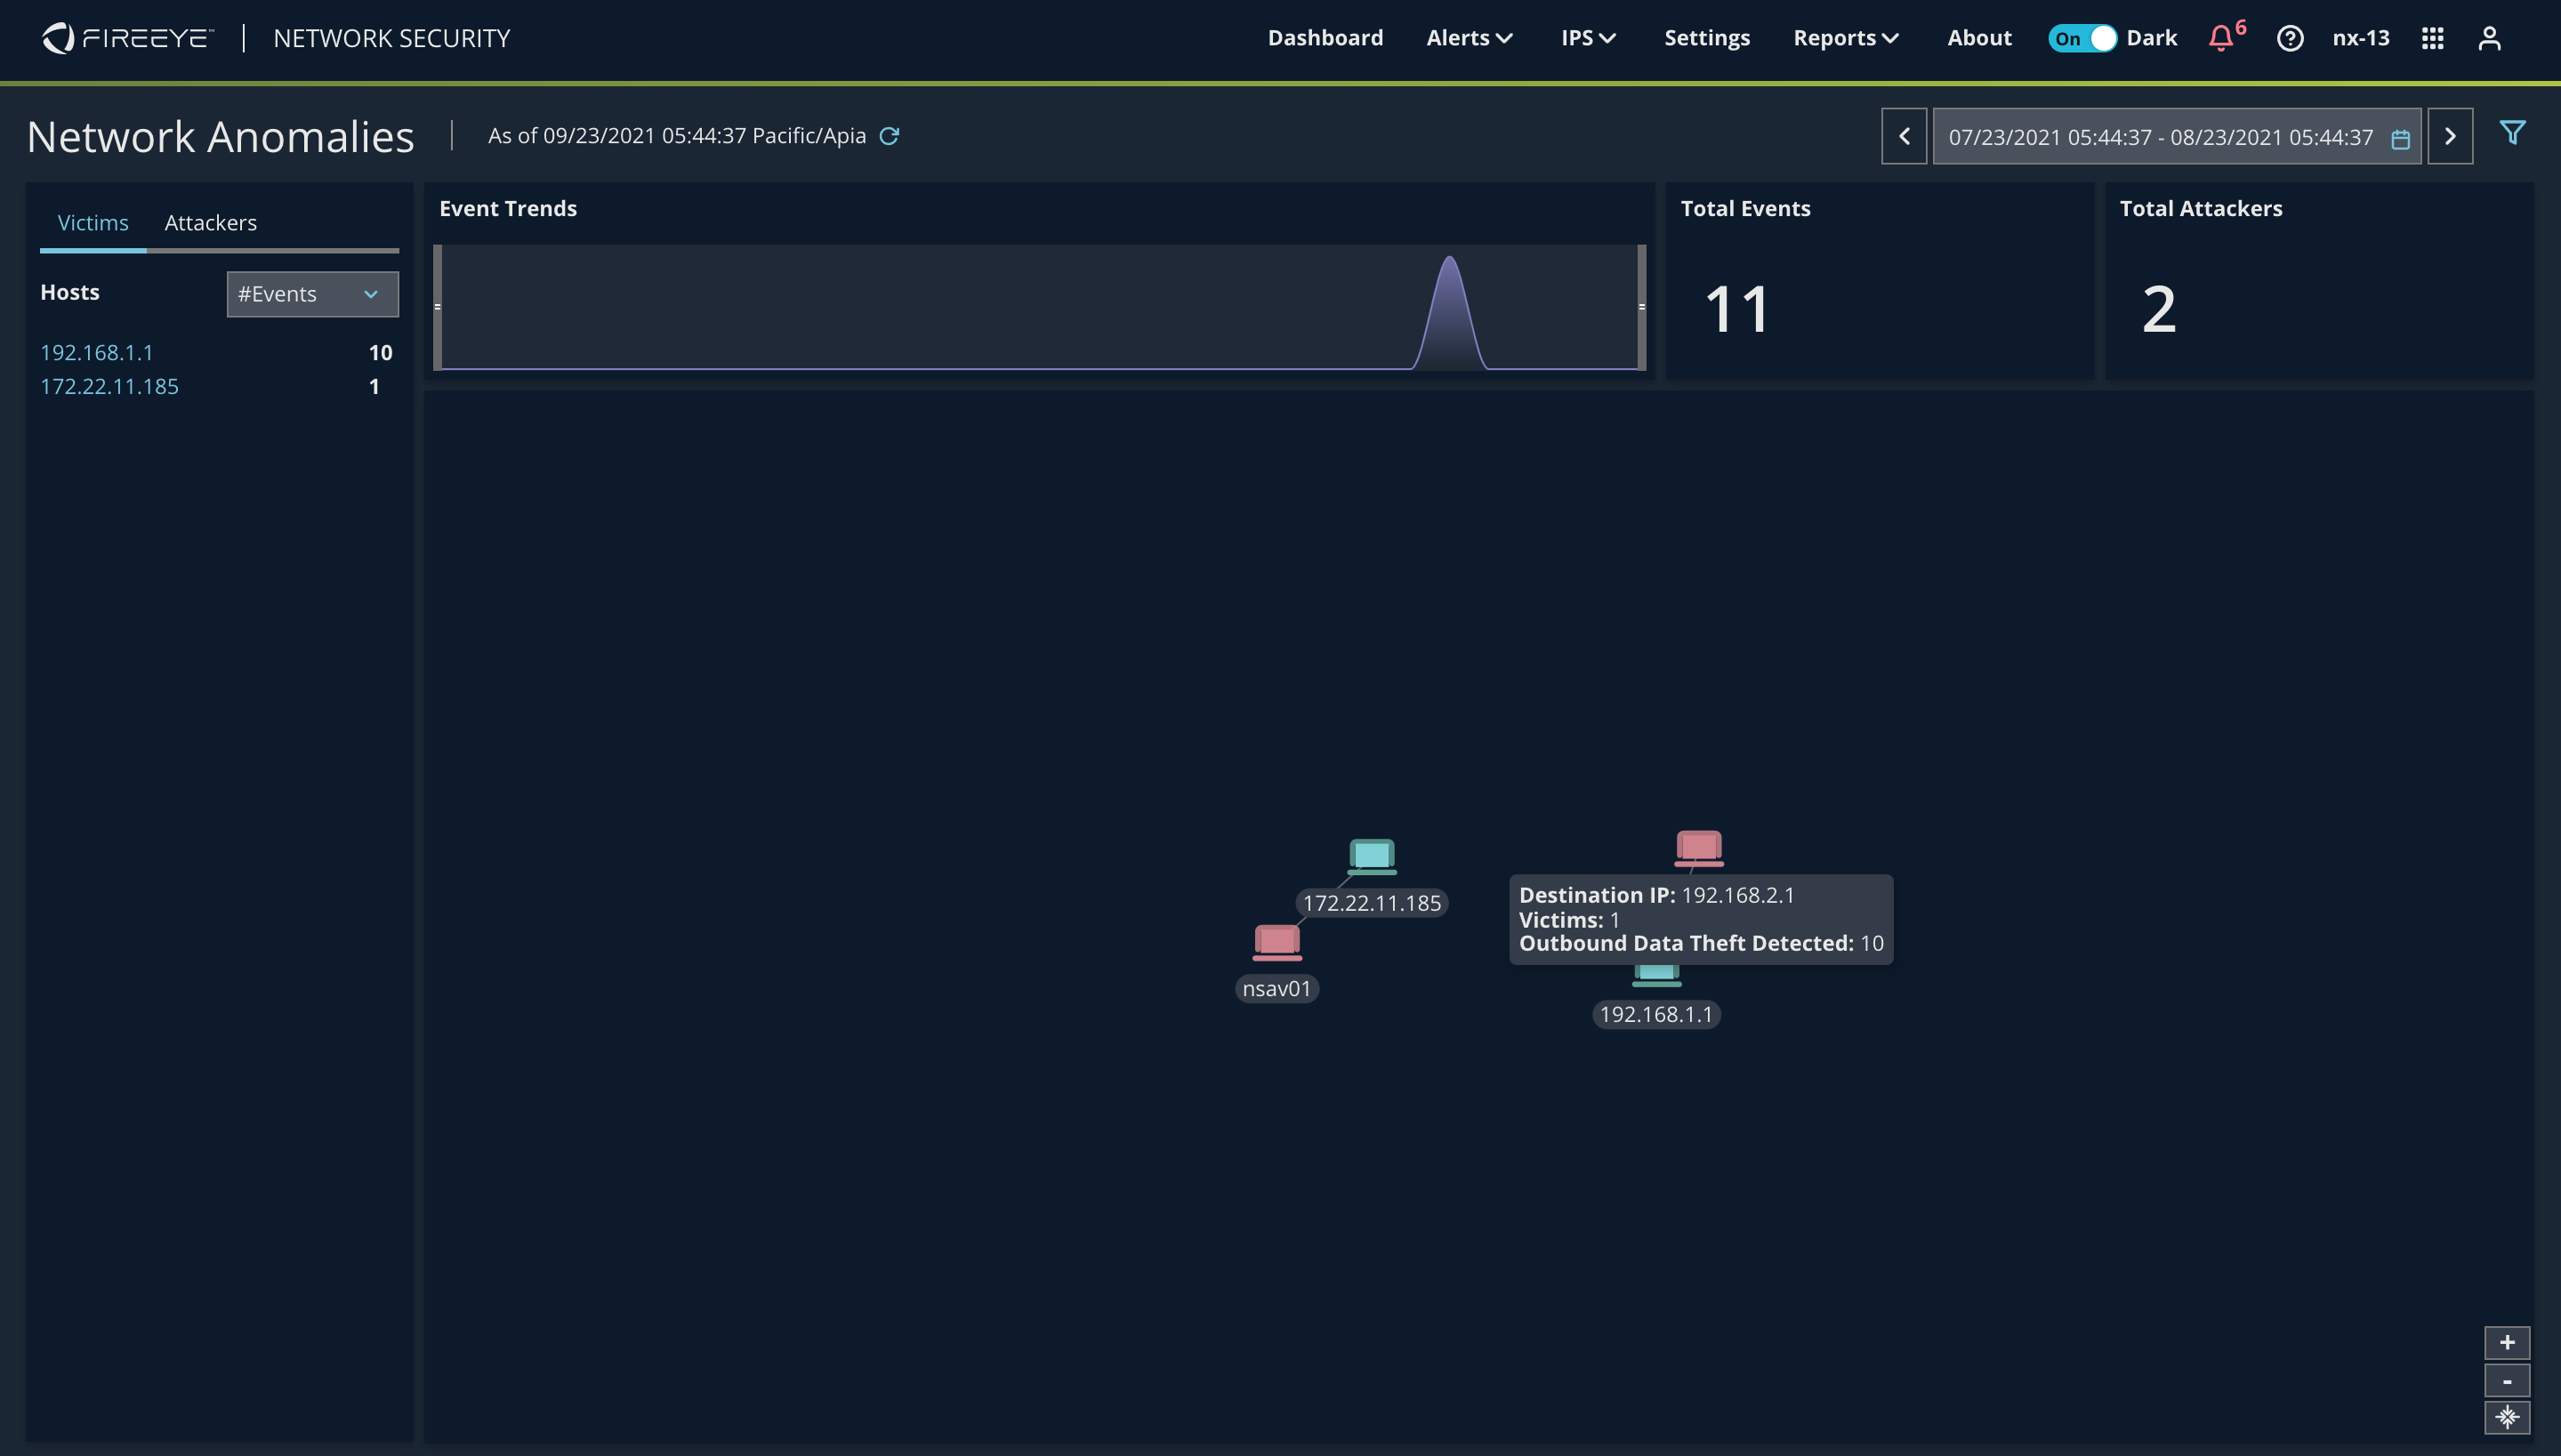
Force-Directed Charts: A force-directed chart displays nodes and links. A red node represents the "attacker" and a green node represents the "victim". The link between the nodes represents the communication between them.
Node Hover: Hover over a node to see a brief description about it.
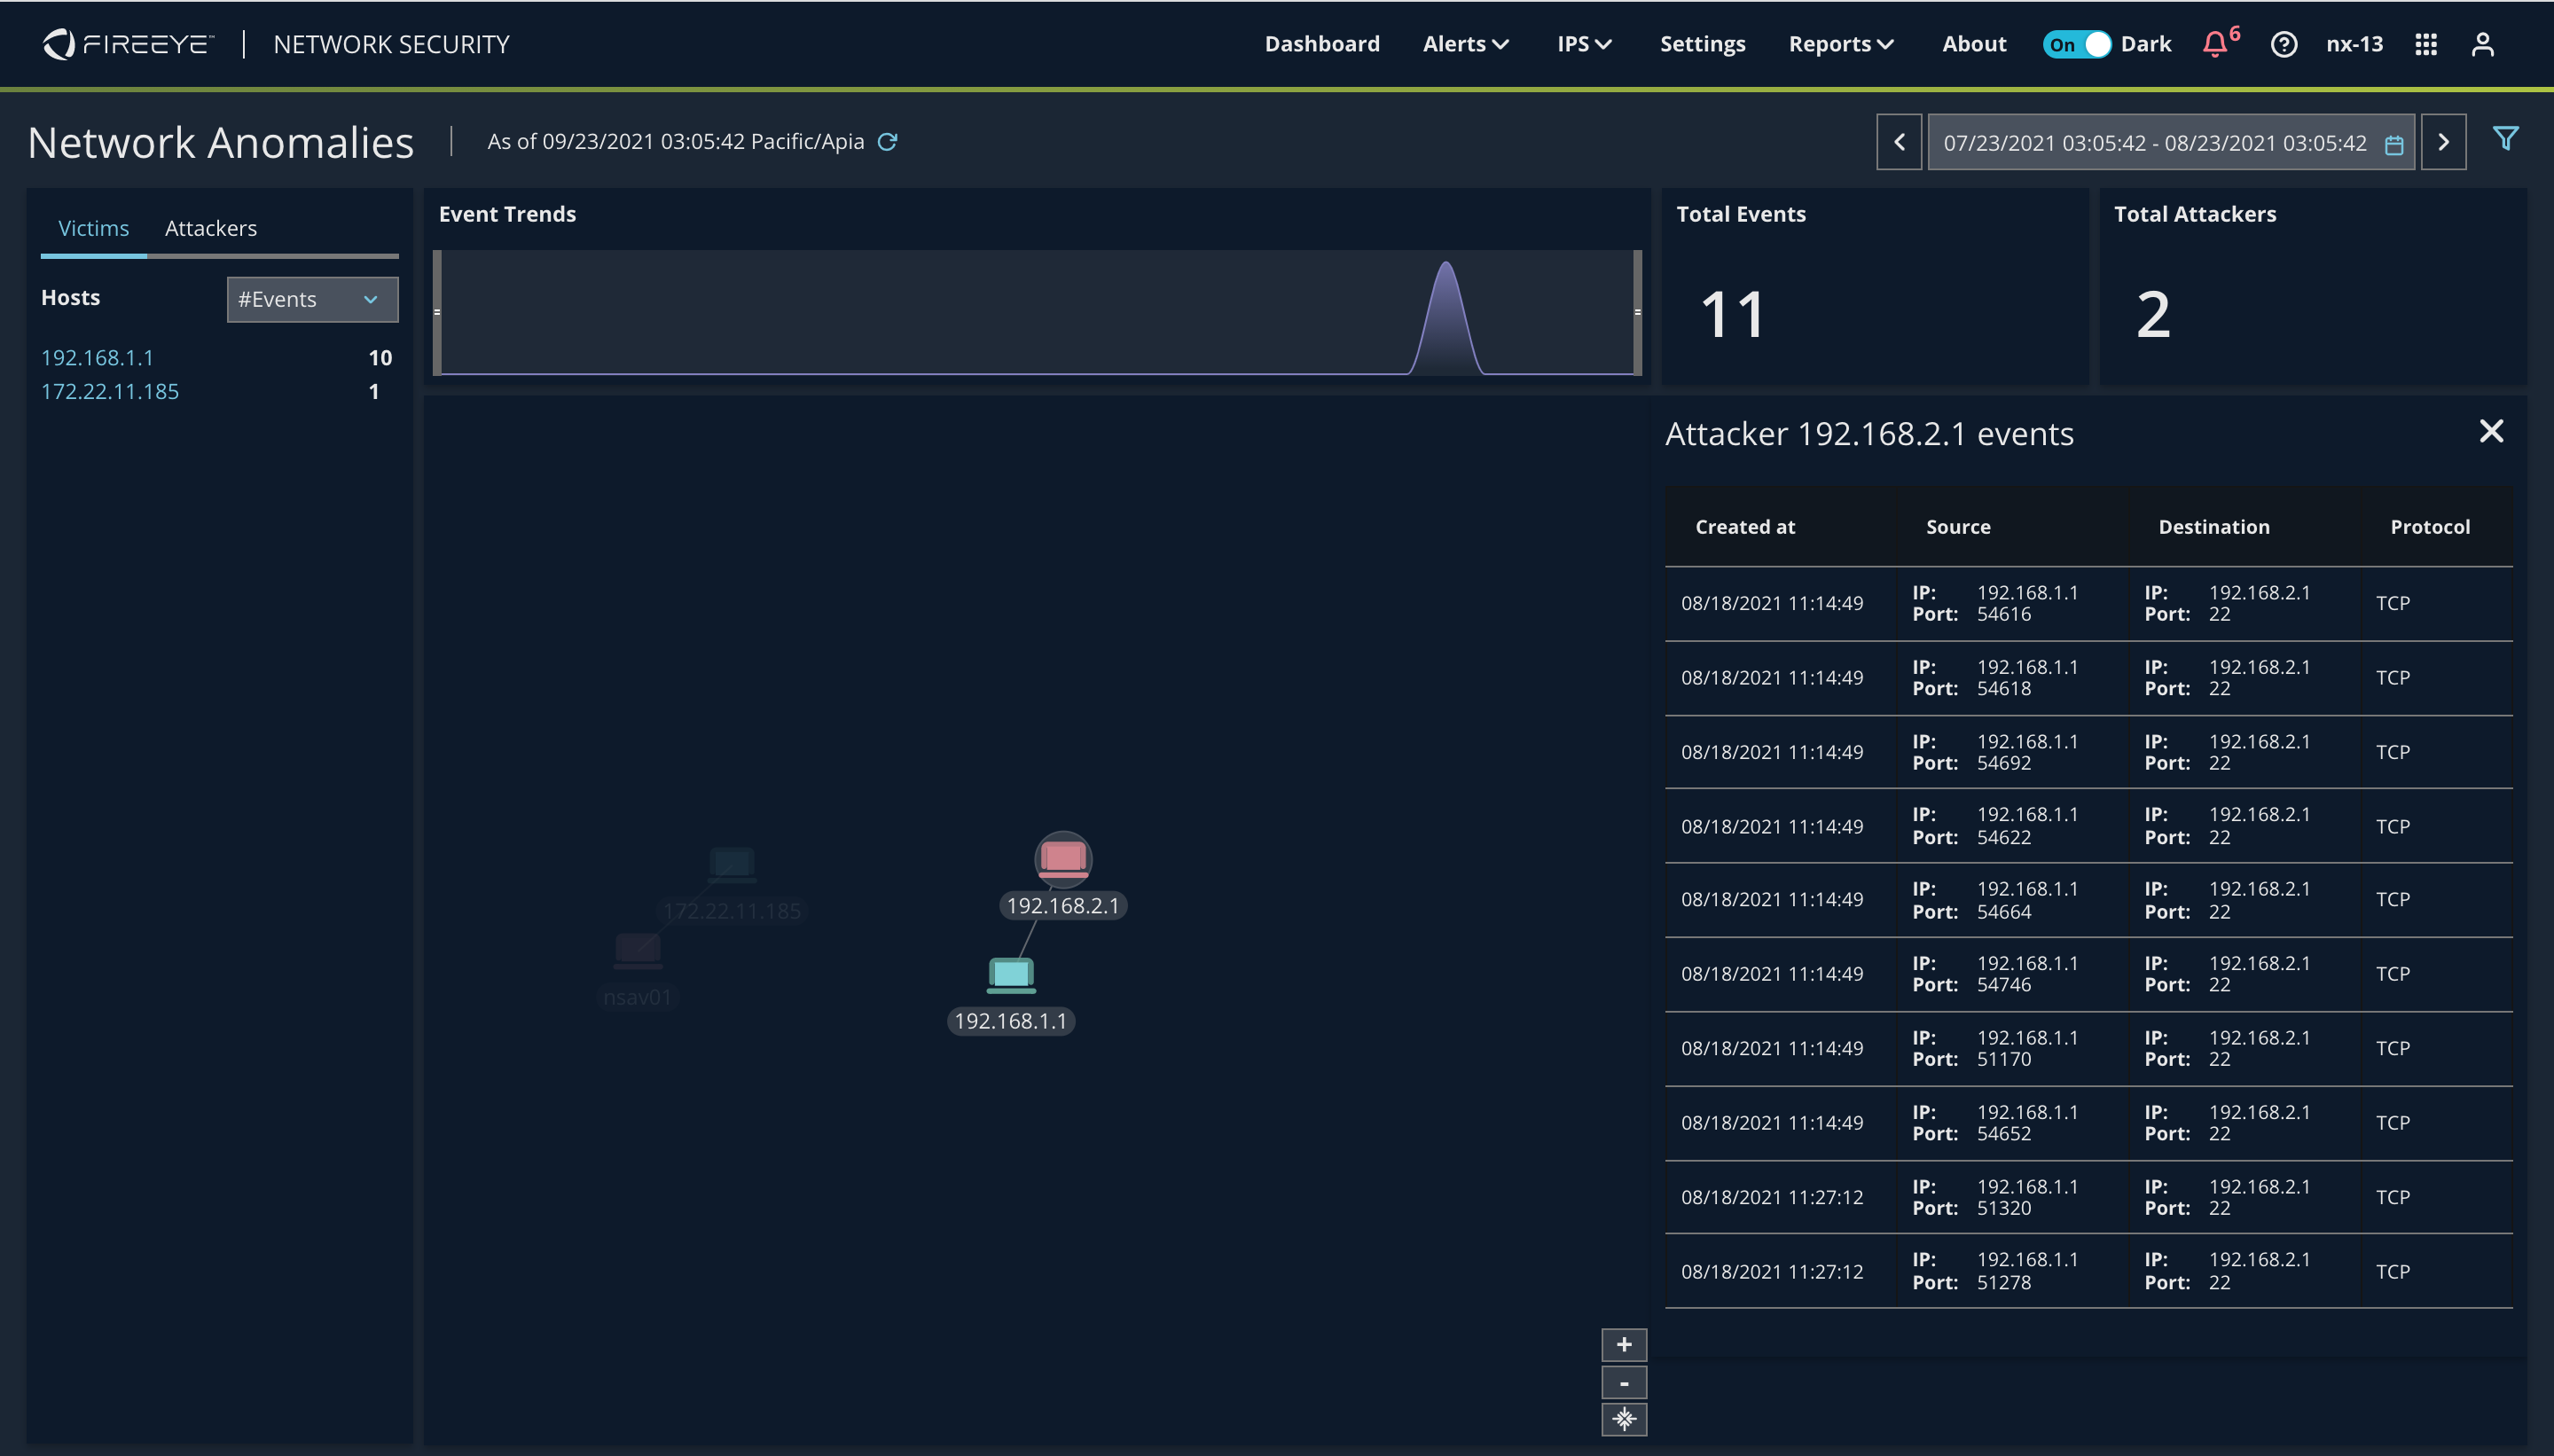
Node Click: Click a node to see a detailed panel of events on the right of the page.
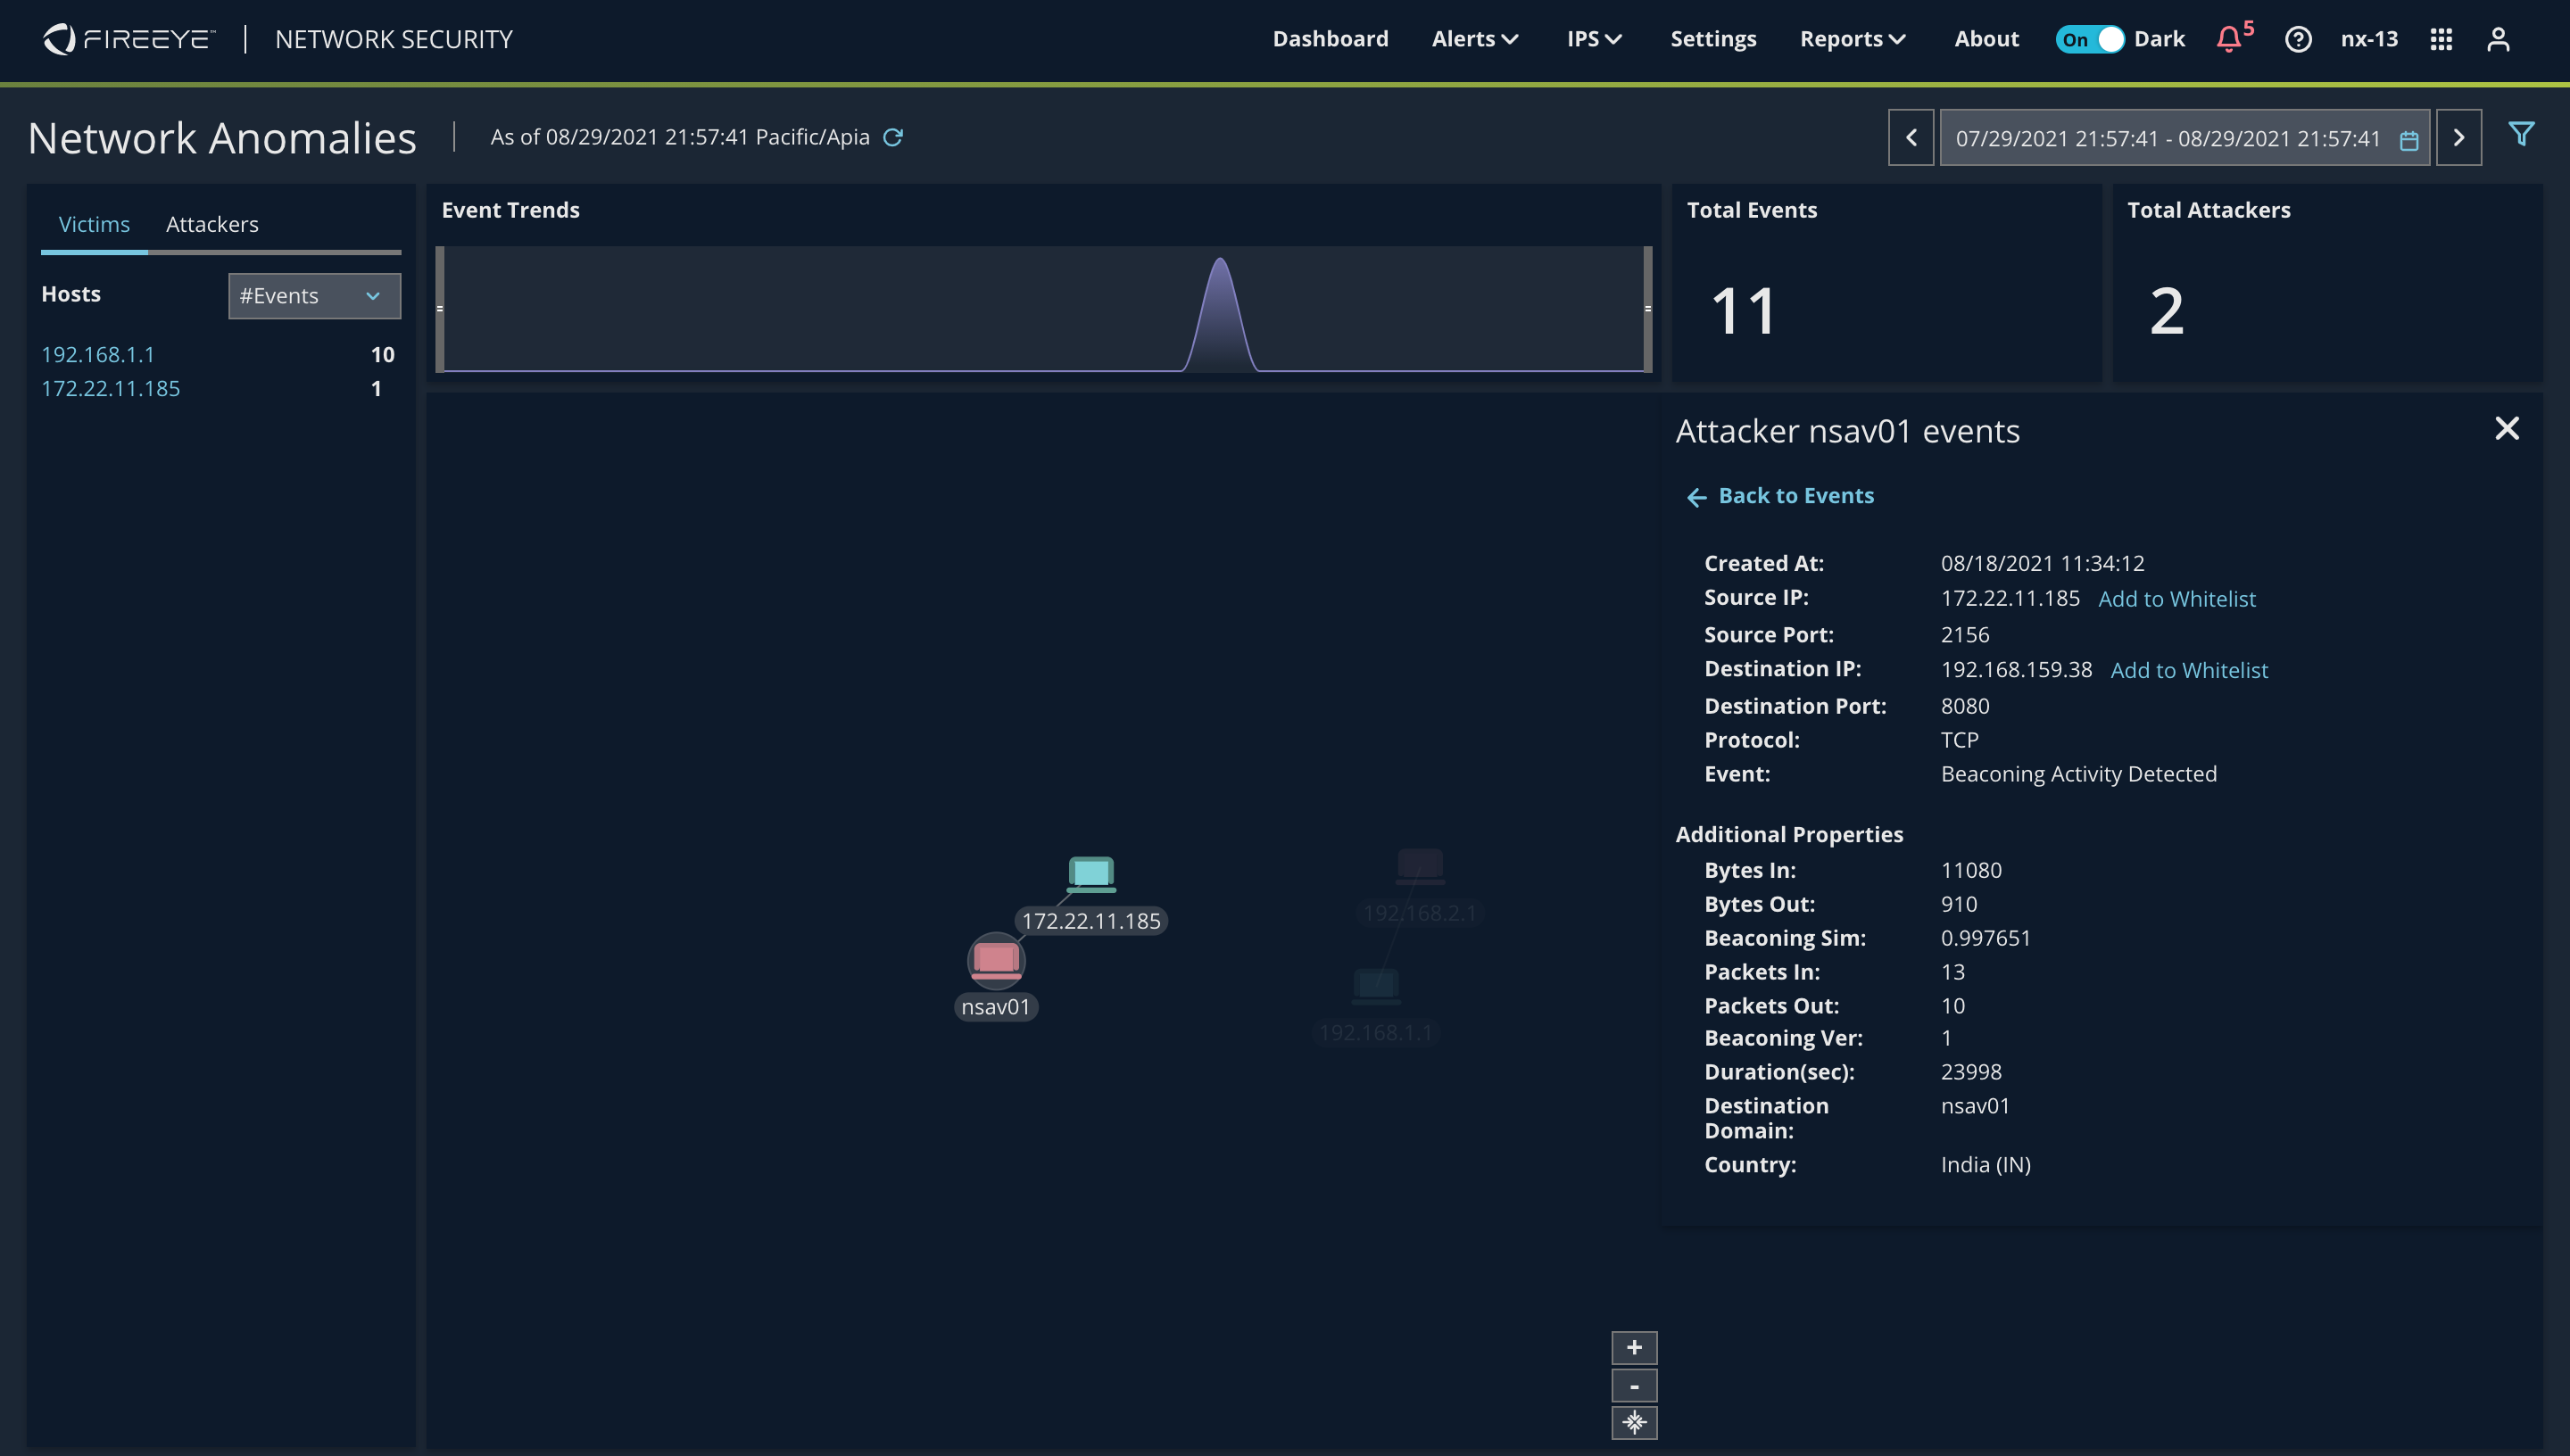
Events Panel: Click an event to view further details about it. Click Back to Events on top of the event details to go back to Events panel. Use the Filter icon on the top right of the page to filter the list of events.
Whitelist an IP address by clicking Add to Whitelist that appears adjacent to it. A popup dialog box appears. Click Confirm to add the IP address to the whitelist. Click Cancel to cancel the operation.
Zoom and reposition buttons: On the bottom right of the page, you will find the buttons to zoom in or zoom out the page. The Reposition button repositions the force directed charts to the centre of the page.
Filter Attributes
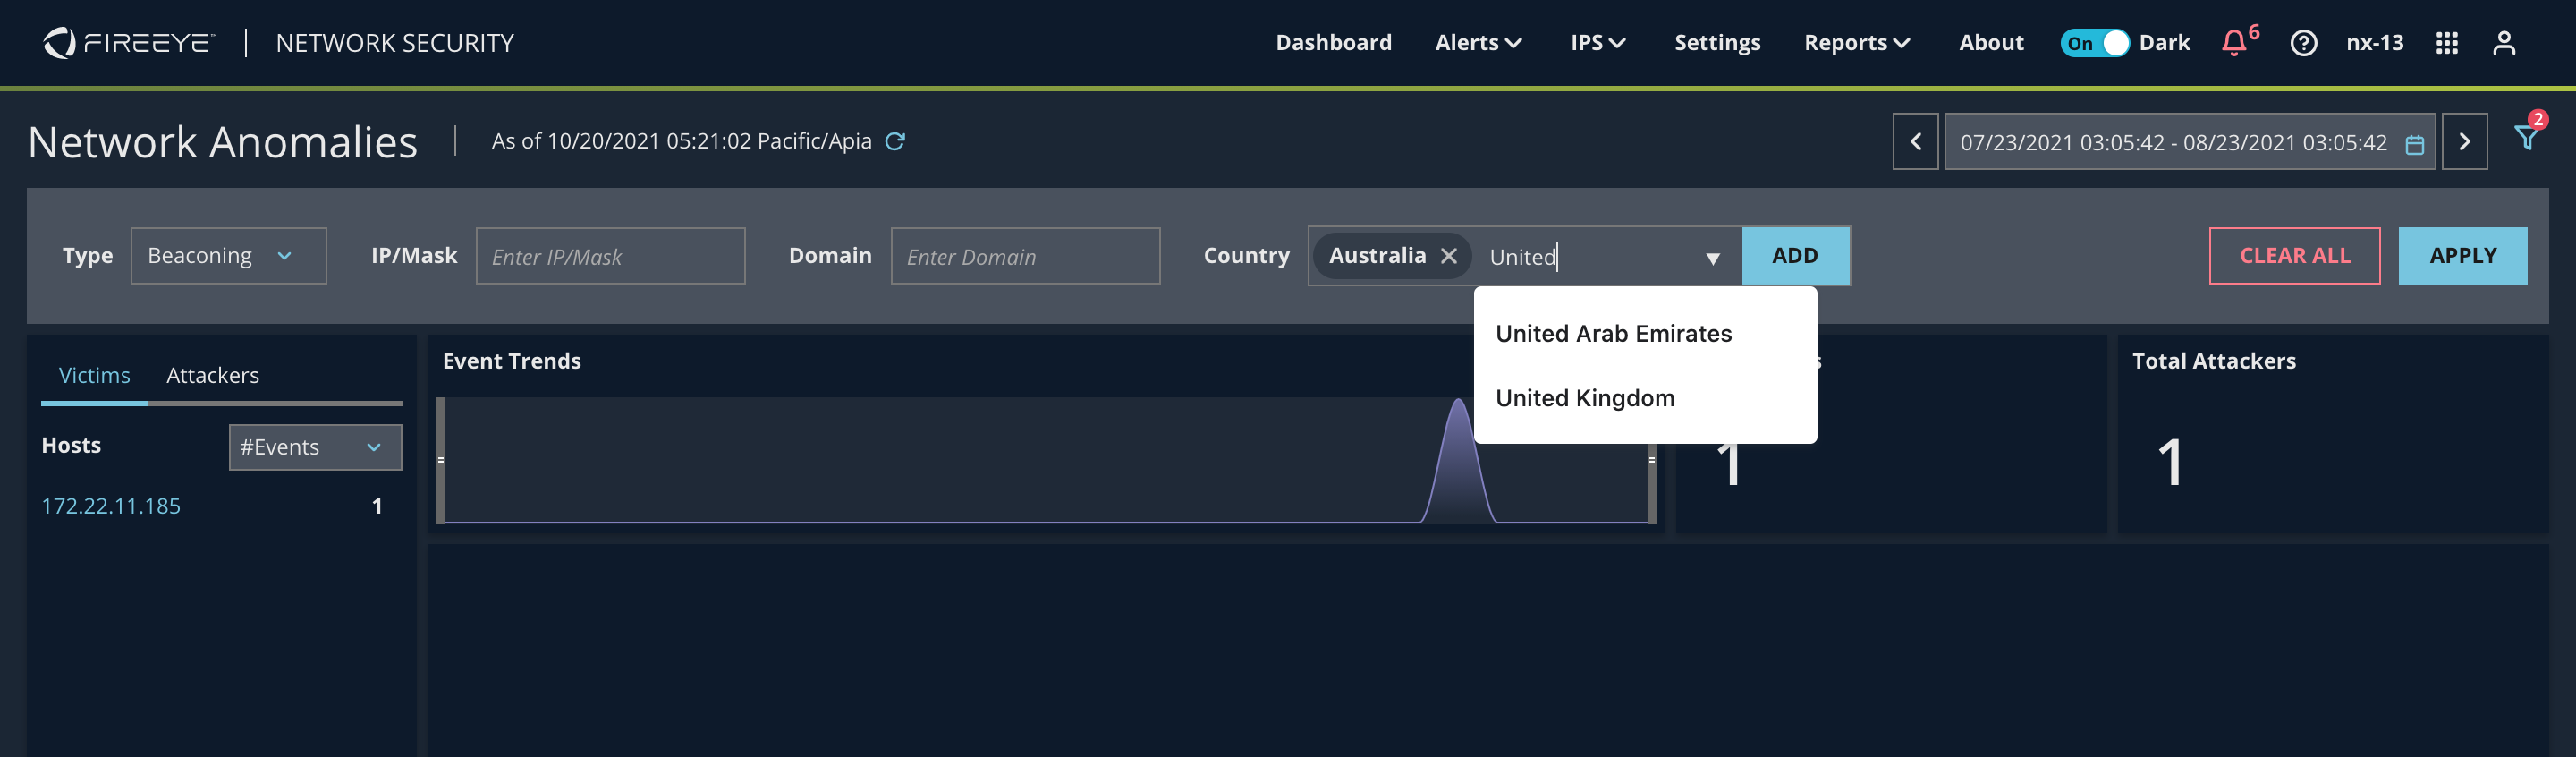
Click the Filter icon on the top right of the page to use the following filter attributes:
Type: Choose the detection type from the drop-down menu - Data Exfiltration or Beaconing.
IP/Mask: Enter a specific IP or subnet address. The input should be a valid IP address with or without mask.
Domain: Enter a specific DNS resolved for an attacker. The input can be any sub string or domain name.
Country: You can enter names of multiple countries. When you start typing a country's name, a suggestion list appears. You can choose from the list as well. Click Add to add the countries.
Click Apply to apply the selected filters. Click Clear All if you need to reset all the filters.