This section assumes the following for deploying the Virtual Sensor for scenario 4.
- The ESX server meets the requirements as discussed in Requirements for deploying the Virtual Sensor.
- You have the privileges on the ESX server to add and modify vSwitches and port groups.
- You have installed the Virtual Sensor and established trust with the Manager successfully. As an example in this scenario, the management port is connected to vSwitch2.
- As an example, this section uses the IPS-VM600 Virtual Sensor to explain the deployment.
- This scenario involves only a Sensor monitoring port pair deployed in inline fail-closed mode.
- This section uses only the vSphere Client for configurations on the ESX.
Task
- Connect the trunk port of Physical switch 1 and Physical switch 2 to two different physical NICs on the ESX.
-
Create two standard vSwitches for connecting Sensor monitoring ports 1 and 2.
Refer to the section Create a standard vSwitch for a monitoring port. Both these switches need physical adapters. For this scenario, vSwitch0 must be assigned a physical adapter that is connected to Physical switch 1. Similarly, vSwitch1 must be assigned a physical adapter that is connected to Physical switch 2.
-
Create a switch port group in vSwitch0, which corresponds to the trunk port on Physical switch 1.
-
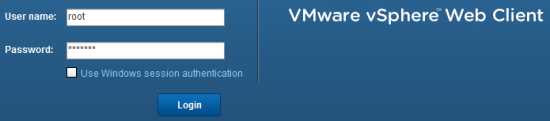
Log on to the ESX as the root user in VMware vSphere Web Client.
-
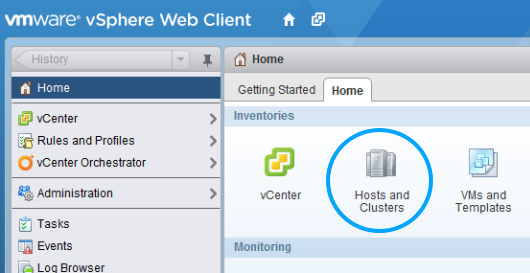
On the vSphere
Home tab, select
Hosts and Clusters.
-
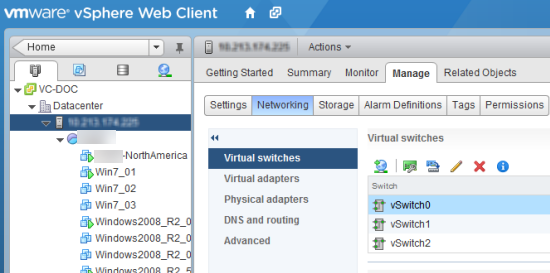
Select the required ESX server and select
Manage → Networking → Virtual switches → vSwitch0.
-
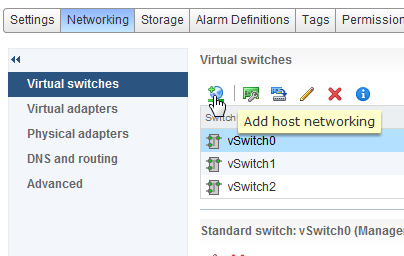
Click on
Add host networking icon for vSwitch0.
-
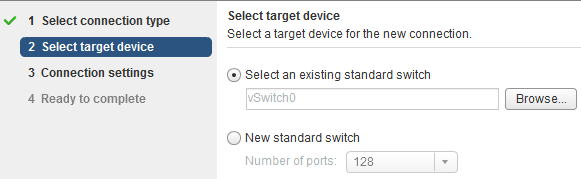
For
Select target device, select
Select an existing standard switch and make sure vSwitch0 is selected.
-
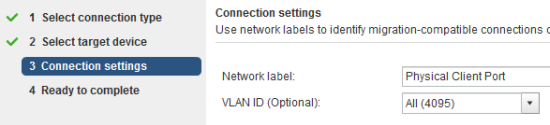
In the
Network Label field, enter a name.
For example, enter Physical Client Port.
-
In the
VLAN ID (Optional) field, select
All (4095) because this switch port group corresponds to the trunk port of a physical switch.
- Click Next and then Finish.
-
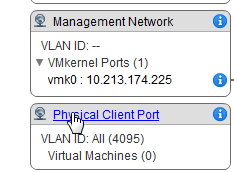
Under
Standard switch: vSwitch0 (VM Network), click on the switch port group that you created.
In this example, it is Physical Client Port.
-
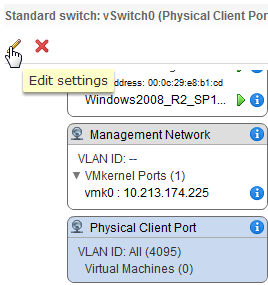
With the switch port group selected, click on the
Edit Settings icon for the switch port group.
-
In the
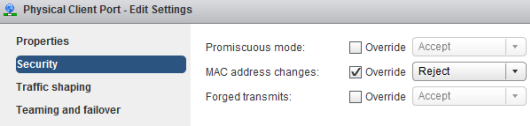
Edit Settings dialog, select the
Security tab and make sure the fields are set with the following values and click
OK.
- Promiscuous mode — Accept. This is set to accept because traffic related to all the hosts connected to Physical switch 1 is involved.
- MAC Address Changes — Reject
- Forged Transmits — Accept
-
Log on to the ESX as the root user in VMware vSphere Web Client.
-
Use the previous step to create a similar switch port group in vSwitch1.
This corresponds to the trunk port on Physical switch 2.
-
Assign the switch port group that you created in step 3 to monitoring port 1.
See the section Specify the switch port groups for monitoring ports.
-
Assign the switch port group that you created in step 4 to monitoring port 2.
See the section Specify the switch port groups for monitoring ports.
Make sure the monitoring port 1 is connected to the corresponding port group (VIPS600-PG-Port1) on vSwitch0 and the monitoring port 2 is connected to the corresponding port group (VIPS600-PG-Port2) on vSwitch1. Both these port groups must have their VLAN ID as All (4095). This is required since the monitoring ports are connected to trunk ports of the physical switches.
-
Verify if you have deployed the Virtual Sensor correctly and whether it is inspecting traffic.
Refer to the section Verify the deployment.