In the Web UI, choose Alerts > Summaries.
The Summaries page appears.
In the drop-down list, choose Malware.
The Malware Summary page appears.
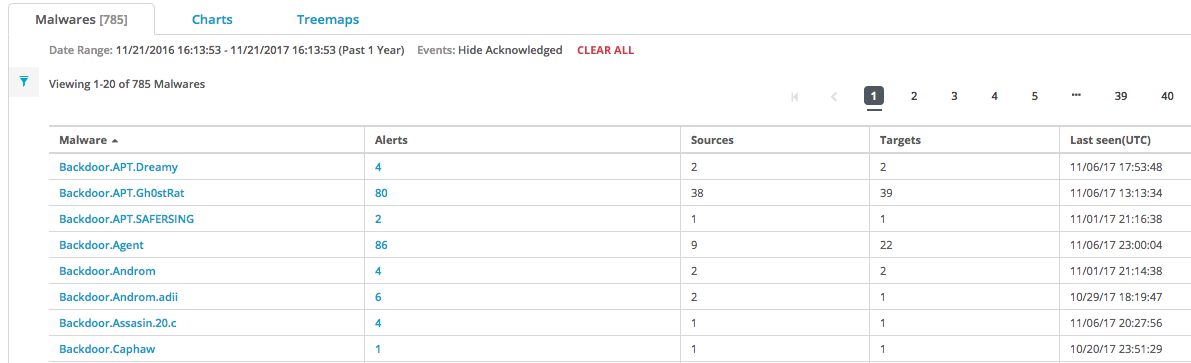
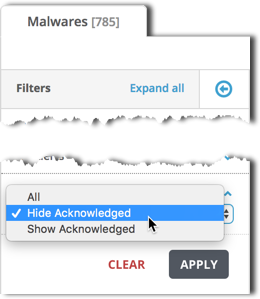
By default, the Events filter is set to Hide Acknowledged and this page shows information about unacknowledged events only. To show information about acknowledged events only, select Show Acknowledged. To view both unacknowledged events and acknowledged events, select All. Acknowledged alerts are identified by a blue bar on the right side of the Host field.
Information for each infection is described in the following table.
Field
Description
Malware
Type of infection that is involved in the attack. For information about the event types, see Alerts and the infection life cycle.
Alerts
Number of events involved in the attack.
Sources
Number of sources involved in the attack.
Targets
Number of targeted hosts involved in the attack.
Most Recent
Most recent event that is involved in the attack.
Last Event
Last event that is involved in the attack.
(Optional) Export a PDF file of the results from the Malware view. The PDF file contains only the content that is visible on the page. For example, if an item on the page is not expanded, the details about that item are displayed and will not be included in the PDF output. To export a PDF, expand sections to show the information you want to capture. Choose the processing time as standard, extra, or heavy. The default processing time is standard. Click Print PDF at the top right-side of the page.
To view filtered events, click the number link.
The events are organized by the following infection types:
Note
If the Network Security appliance is configured for inline operation, and if the numeric link is a callback, the Filtered Events details will display the blocking action that was taken.
Binary Analysis
CnC SigMatch
Domain Match
Infection Match
Web Infection
In the Filtered Events page, click the arrow located to the left of an event type. The view expands to display the event details. For information about field descriptions for filtered events, see Monitoring malware and callback activity using the Web UI.
By default, the Charts filter is set to Hide Acknowledged and this page shows information about all unacknowledged events. To include acknowledged events, select All. To show only acknowledged events, select Show Acknowledged.
In the Web UI, choose Alerts > Summaries.
The Summaries page appears.
In the drop-down list, choose Charts.
The Charts Summary page appears.
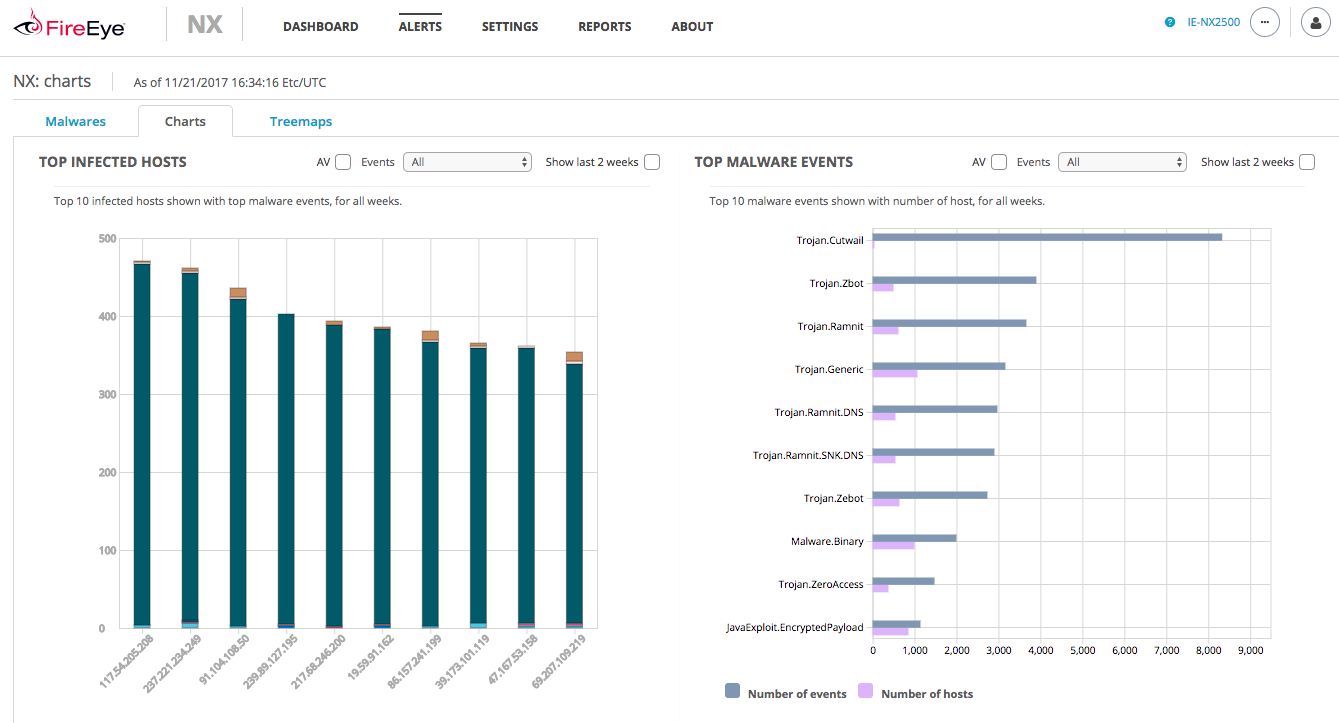
By default, the Events field is set to All and this page shows information about all events. To view information about unacknowledged alerts only, select Hide Acknowledged. To view information about acknowledged events only, select Show Acknowledged.
The top infected hosts and top malware events are displayed in a bar chart. Charts are described in the following table.
Chart
Description
Top Infected Hosts
Displays a bar for the total number of malware events. Color-coded segments represent the different malware event types. For example, the gray segments in the figure above represent the number of malware-binary events.
Top Malware Events
Displays pair of bars for each type of malware event. The upper bar represents the total number of events of that type, and the lower bar represents the number of infected hosts.
To display only data from the last two weeks, click Show last 2 weeks.
To display all the time periods, click Show all weeks.
By default, all available time periods are displayed.
(Optional) Export a PDF file of the results from the Charts view. The PDF file contains only the content that is visible on the page. For example, if an item on the page is not expanded, the details about that item are displayed and will not be included in the PDF output. To export a PDF, expand sections to show the information you want to capture. Choose the processing time as standard, extra, or heavy. The default processing time is standard. Click Print PDF at the top right-side of the page.
Note
Greylists must be enabled by means of the CLI. For information about enabling greylists, see Enabling greylists using the CLI .
In the Web UI, choose Alerts > Summaries.
The Summaries page appears.
In the drop-down list, choose Greylist Charts.
The Greylist Charts Summary page appears.
By default, the Events field is set to All and the chart shows information about both unacknowledged events and acknowledged events. To view information about unacknowledged events only, select Hide Acknowledged. To view information about acknowledged events only, select Show Acknowledged.
Greylist charts are described in the following table.
Chart | Description |
|---|---|
Greylist Matches | Displays the 15 greylists with the largest number of total matches. The total matches are divided into Not Analyzed and Malicious counts. The greylist type (URL or IP) is also displayed. |
Greylist Efficiency % | Displays the efficiency for the greylist based on a time interval of either 24 hours or 2 weeks. The efficiency is the total number of malicious matches divided by the total number of matches, shown as a percentage. Click the eye icon to the right of a greylist name on the floating legend to either show or hide the graph for that greylist. |
Note
Greylists must be enabled by using the CLI. For information about enabling greylists, see Enabling greylists using the CLI .
In the Web UI, choose Alerts > Summaries.
The Summaries page appears.
In the drop-down list, choose Greylist Table.
The Greylist Table Summary page appears.
By default, the Events field is set to All and the chart shows information about both unacknowledged events and acknowledged events. To view information about unacknowledged events only, select Hide Acknowledged. To view information about acknowledged events only, select Show Acknowledged.
The greylist table fields are described in the following table.
Field | Description |
|---|---|
Greylist | Name of the greylist file. |
Type | IP or URL. |
Priority Boost | Value for the user-assigned priority for the greylist (0.0-25.0). A high priority can be assigned to URLs or IP addresses that have a high probability of hosting malware and a low priority to URLs or IP addresses that are not likely to host malware. |
Total Match | Total number of occurrences that match the greylist URLs or IP addresses. |
Malicious | Number of occurrences that have been processed and match the URLs or IP addresses in the greylist file. |
Not Analyzed | Number of occurrences that have not yet been processed. |
Efficiency % | Total number of malicious matches divided by the total number of matches, shown as a percentage. |
Click an individual box to display details for that signature or network.
Field | Description |
|---|---|
By Signatures | Each box represents a malware event type, identified by name. |
By Hosts | Each box represents an infected network, identified by the IP address. |
Subnet Mask | Select the subnet mask for the treemap. |
Timeframe | Specify the time period of the display. |
Show events by | Select the area or color button to highlight the significance of the events by area (larger area indicates more events) or depth of color (darker color indicates more infections). |
In the Web UI, choose Alerts > Summaries.
The Summaries page appears.
In the drop-down list, choose Treemaps.
The Treemaps Summary page represents the number and the severity of the infections with different box sizes and colors.
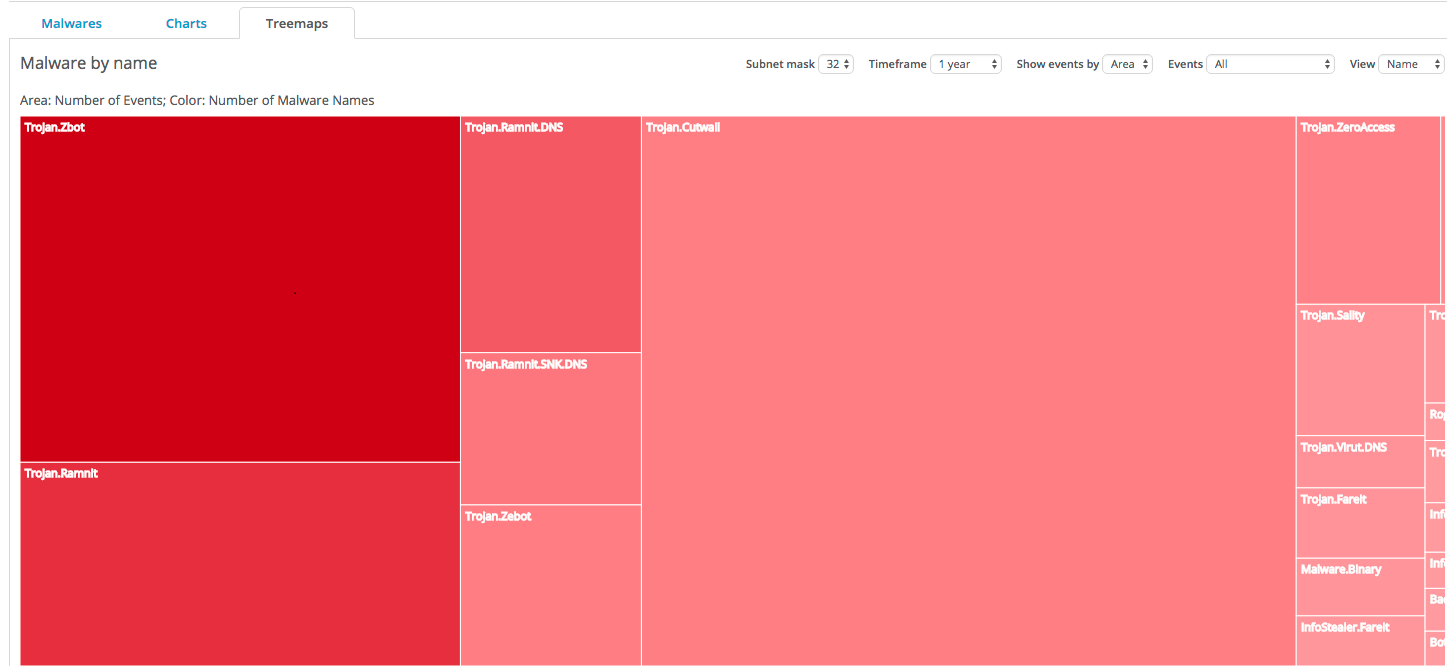
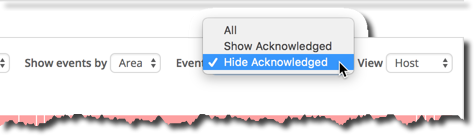
By default, the Events field is set to Hide Acknowledged and the treemap shows information about unacknowledged events only. To show information about acknowledged events only, select Show Acknowledged. To view both unacknowledged events and acknowledged events, select All.
You can view the treemap by signatures or hosts using the controls at the top of the page. Fields are described in the following table.