The purpose of Telemetry is to facilitate you in providing helpful information to Trellix about your usage of Trellix IPS solution so that Trellix in turn optimizes your protection.
Note
The Telemetry pop-up is displayed when you open the Manager for the first time.
Note
Telemetry data is stored in the Telemetry server indefinitely.
To configure Telemetry:
Task
-
Select
Manager → <Admin Domain Name> → Setup → Telemetry.
The Telemetry page is displayed.
Telemetry page 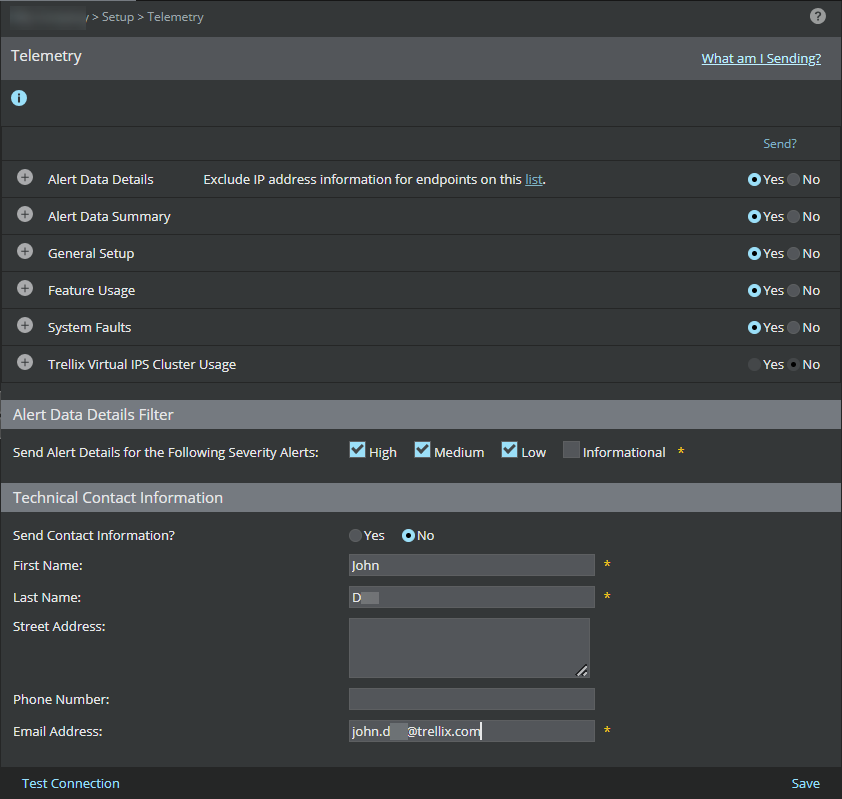
Note
The following options are enabled in the Telemetry page by default:
- Alert Data Details
- Alert Data Summary
- General Setup
- Feature Usage
- System Faults
- Trellix Virtual IPS Cluster Usage
The Trellix Virtual IPS Cluster Usage option can be configured only when there is a vIPS Cluster in the Manager.
Note
If at any point, you want to review what you are sending to the Telemetry server, run the Default-Telemetry (IPS/Insights) Next Generation report.
-
Select either
Alert Data Details or
Alert Data Summary to enable GTI IP Reputation integration.
Using the Telemetry page, you can configure the following information categories:
- Alert Data Details — Select
Alert Data Details for complete integration with GTI IP Reputation. This permits you to report, filter, and sort hosts involved in attacks based on their network reputation and/or country of their origin. When the
Alert Data Details option is selected, the following attributes are sent in real time to
Trellix Labs for each attack:
- Application Name
- Attack Name
- Attack Time
- Attacker DNS Name
- Attacker IP Address
- Attacker Country
- Attacker OS
- Attacker Port
- Attacker Risk
- Callback alert information
- Category
- Count
- Detection Mechanism
- Direction of Attack
- For correlated alerts: Triggered component attacks and their connection logs
- For heuristic attacks against Web application servers: Threshold, confidence, weight, and the matched blocked strings
- For Intelligent Sandbox attacks: File name, size, type, MD5 hash, UUID, and malware confidence
- Malware Engine Results
- Malware URL
- Trellix IPS Attack ID
- Protocol
- Relevance (and method used to determine it)
- Result
- Signature ID
- Sub-Category
- Target DNS Name
- Target IP Address
- Target Country
- Target OS
- Target Port
- Target Risk
- Type
- URI
- A count of each attack seen
- The list of Trellix IPS attack IDs seen
- Manager software version and active signature set version
- Alert Data Summary
— The following alert summary information is sent hourly to
Trellix Labs:
- A count of each attack seen
- The list of Trellix IPS attack IDs seen
- The number of alerts whose relevance was determined by each available method
- Top 10 (as per executable confidence) EIA attacks
- General Setup
— The following general setup information is sent daily to
Trellix Labs:
- Manager software version and active signature set version (so the alert data can be correctly interpreted)
- Manager install type
- Manager OS type, OS version, and VM type (if applicable)
- Manager GUID, MDR GUID (as applicable), and Telemetry GUID
- Is a Central Manager in use
- Is Manager Disaster Recovery (MDR) in use
- OS type, OS version, and VM type (if applicable) of each device
- Serial number, model, software, and hardware version of each device
- Is each device part of an HA pair and/or Stack
- The number of monitor ports operating in inline, SPAN, and tap modes
- The number of dedicated, CIDR, and VLAN interfaces defined
- The number of administrative users, the custom roles in use, and the permissions in those roles
- Callback Detector and GAM version for each active device
- Interface name, protection category and assigned IPS, Malware and Inspection Options policy IDs
- Feature Usage — The following feature usage information is sent daily to
Trellix Labs:
- Are inbound MSRPC/SMB fragments being reassembled
- Are outbound MSRPC/SMB fragments being reassembled
- Callback Detectors status and version
- Gateway Anti-Malware engine and DAT versions
- Is ePO integration enabled
- Is MVM integration enabled to run vulnerability scans
- Is MVM integration enabled to calculate alert relevance
- Is IPS alert notification enabled (SNMP, syslog, email, pager, script)
- Is inbound GTI IP reputation lookup enabled
- Is outbound GTI IP reputation lookup enabled
- Is GTI IP reputation lookup used to enhance SmartBlocking decisions
- Is inbound heuristic Web application server protection enabled
- Is outbound heuristic Web application server protection enabled
- Is inbound XFF header parsing enabled
- Is outbound XFF header parsing enabled
- Is advanced callback detection enabled, and are events sent to NTBA for further analysis
- Is inbound chunked HTTP response traffic being decoded
- Is outbound chunked HTTP response traffic being decoded
- Is inbound HTML-encoded HTTP response traffic being decoded
- Is outbound HTML-encoded HTTP response traffic being decoded
- Is inbound base64-encoded SMTP traffic being decoded
- Is outbound base64-encoded SMTP traffic being decoded
- Is inbound GTI URL Reputation enabled
- Is outbound GTI URL Reputation enabled
- Is inbound Deep File Inspection enabled
- Is outbound Deep File Inspection enabled
- The L7 data collected (protocols and their fields)
- The advanced malware policy definitions
- The list of methods enabled for determining alert relevance
- The number of default IPS policies in use
- The number of custom IPS policies in use
- The number of custom Trellix IPS-format attacks in use
- The number of Snort rules in use
- The number of ignore rules defined
- The number of M-series devices with IPS licenses assigned
- The number of sub-interfaces in use
- The number of device-pre firewall policies assigned
- The number of port firewall policies assigned
- The number of interface firewall policies assigned
- The number of device-post firewall policies assigned
- The number of IPS attack definitions whose default settings have been customized
- The number of custom NextGen reports and their SQL queries
- The number of interfaces with application identification enabled
- The number of IPS devices with Trellix Intelligent Sandbox integration enabled and malware policies with Intelligent Sandbox analysis enabled
- The number of NTBA devices with EIA integration enabled
- The number of Virtual IPS sensors and Virtual IPS sensor licenses
- The number of Interfaces using policy group
- The number of custom policy group assigned
- The number of default policy group assigned
- The number of devices enabled inbound SSL decryption
- The number of devices enabled inbound SSL decryption with Diffie-Hellman
- Total number of devices with outbound SSL decryption enabled
- Name, grant ID, license key, Sensor model, and allowance count associated with each proxy SSL decryption license
- Total number of devices assigned a system license
- The number of system licenses available and in use
- Name, grant ID, license key, expiration, model and device associated with each system license
- Block and alert only based CVE coverage for each of the IPS policies in use
- Engine status and file types enabled for each of the Malware policies in use
- Option status for each of the Inspection options policies in use
- System Faults — The following System Fault information is sent daily to
Trellix Labs:
- Device Faults
- Manager Faults
Note
Though these two events are represented separately, they are sent to GTI as a single event.
- Trellix Virtual IPS Cluster Usage — The following data specific to vIPS clusters is sent to
Trellix daily:
- Name and grant ID associated with each Virtual IPS Sensor license
- Overall license compliance status
- Total number of allowed virtual Sensors
- Total number of Virtual Sensors currently in use with vIPS Clusters
- Total number of Virtual Probes currently in use with vIPS Clusters
- Maximum number of Virtual Probes used
- Manager version
- Alert Data Details — Select
Alert Data Details for complete integration with GTI IP Reputation. This permits you to report, filter, and sort hosts involved in attacks based on their network reputation and/or country of their origin. When the
Alert Data Details option is selected, the following attributes are sent in real time to
Trellix Labs for each attack:
-
Select
Yes on the relevant information categories for which you prefer to send details to
Trellix Labs.
- After configuring the Alert Data Details and Alert Data Summary, navigate to the Attack Log page.
- Select the alert and click Other Actions → Perform GTI Forensics.
- Click on attacker or target IP address. A new browser window opens, displaying information on that URL.
Note
If Global Threat Intelligence is not enabled in the GTI page, the Perform GTI Forensics option is disabled.
-
In the
Alert Data Details Filter, select the type of alert severity, based on which you want to send the information.
The available options are:
- High
- Medium
- Low
-
Informational
Note
The Alert Data Details Filter is displayed only when you select Alert Data Details category.
-
In the
Technical Contact Information, update the following fields to provide your contact information to
Trellix Labs.
- Send Contact Information?
- First Name
- Last Name
- Street Address
- Phone Number
- Email Address
- To check whether communication to the GTI server is established, click Test Connection.
- Click Save.