The sections of the pie chart in this panel represent the number of hosts that triggered critical malware detection alerts over the past day, week, or month.
MVX [VM detected hosts]—The blue section shows the number of hosts that triggered malware or Web infection alerts during the specified time period.
Callback hosts—The red section shows the number of hosts that attempted to communicate with a botnet server during the specified time period.
By default, the panel counts unacknowledged alerts triggered over the past 24 hours.
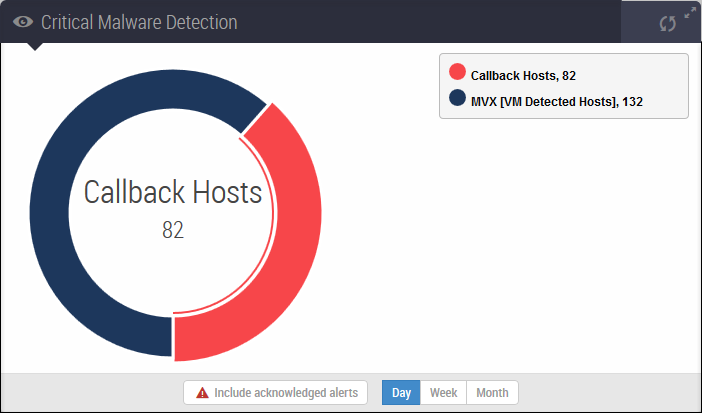
Use the controls at the bottom of the panel to change the display as follows:
Include or exclude acknowledged alerts.
Change the period of time covered by the display (day, week, or month).
The sections of the pie chart contain shortcuts to the Alerts tab:
Click the blue MVX [VM Detected Hosts] section to view individual alert groupings, grouped by attack rule name, for critical malware and Web infections.
Click the red Callback Hosts section to view individual alert groupings, grouped by attack rule name, for critical callback events.
For details, see Alerts grouped by attack rule names.
The following table lists the filter criteria for the two critical malware groups in the chart.
Critical malware category | Match values in the Alerts tab | |
|---|---|---|
Show critical | Type | |
MVX [VM Detected Hosts] | Yes |
|
Callback Hosts | Yes |
|