This panel lists an alert count for each attack category detected on the monitored network during the past day, week, or month. By default, the panel displays alert counts for the past 24 hours. The alert counts exclude acknowledged alerts. The following is an example of a default view of the What's Happening panel.
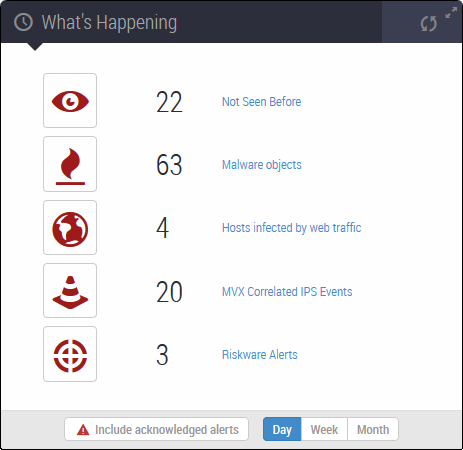
You can use the controls at the bottom of the panel to adjust the data displayed:
Include or exclude acknowledged alerts
Change the period of time covered by the display
The attack category names are shortcuts to the Alerts tab, the MVX‑Correlated IPS Events page, or the Alerts > Riskware page.
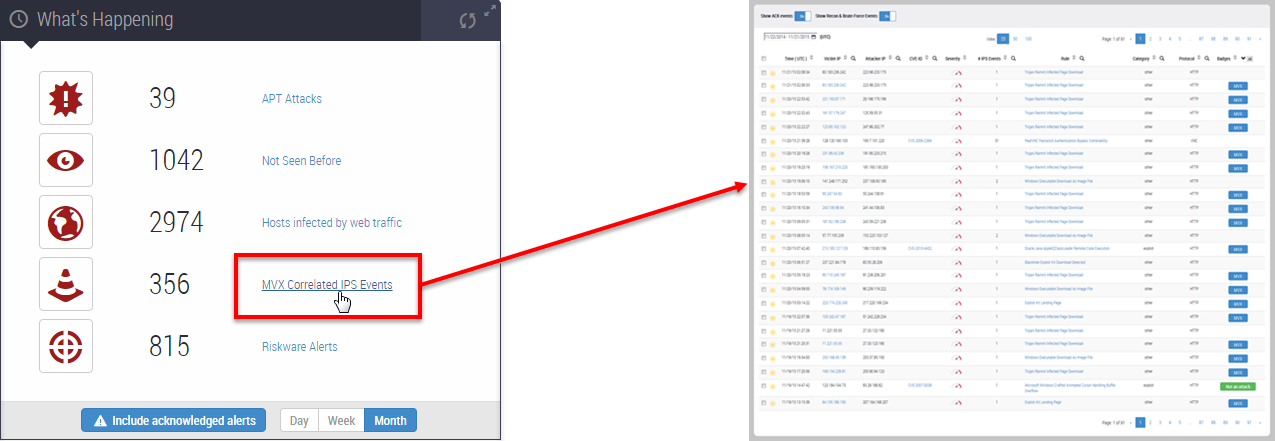
For information about the Alerts tab, see Alerts grouped by attack rule names. For information about the IPS Events page, see About the IPS events page. For information about the Alerts > Riskware page, go to the Network Security User Guide.
The following table describes attack categories that can appear in the What's Happening panel. Click the attack category name to view the individual alerts in that category.
Icon | Attack category | To view individual MVX‑correlated alerts | ||
|---|---|---|---|---|
| Advanced Persistent Threats | Click APT Attacks. The Alerts page lists entries that match one of the following value in the Malware column: ● .APT. ● _APT_ | ||
| Attacks not seen before | Click Not Seen Before. The Alerts page lists entries that match one of the following values in the Malware column: ● Exploit.Browser ● Malware.ZerodayMatch ● Malware.Binary ● Malware.ZerodayCallback ● ^DTI.Callback | ||
| Clients infected | Click Hosts Infected by Web Traffic. The Alerts page list entries that match the following value in the Type column: ● Web Infection | ||
| Malicious domain matches | Click Malicious domain match. The Alerts page lists entries that match the following value in the Type column: ● Domain Match | ||
| Malware objects downloaded | Click Malware Objects, The Alerts page lists entries that match the following value in the Type column: ● Malware Object | ||
| MVX-Correlated IPS Events | Click MVX Correlated IPS Events. The IPS Events page lists entries that have an MVX badge.
| ||
| Riskware Alerts | Click Riskware Alerts. The Riskware page lists entries that match the following value in the Type column: ● Riskware Object |


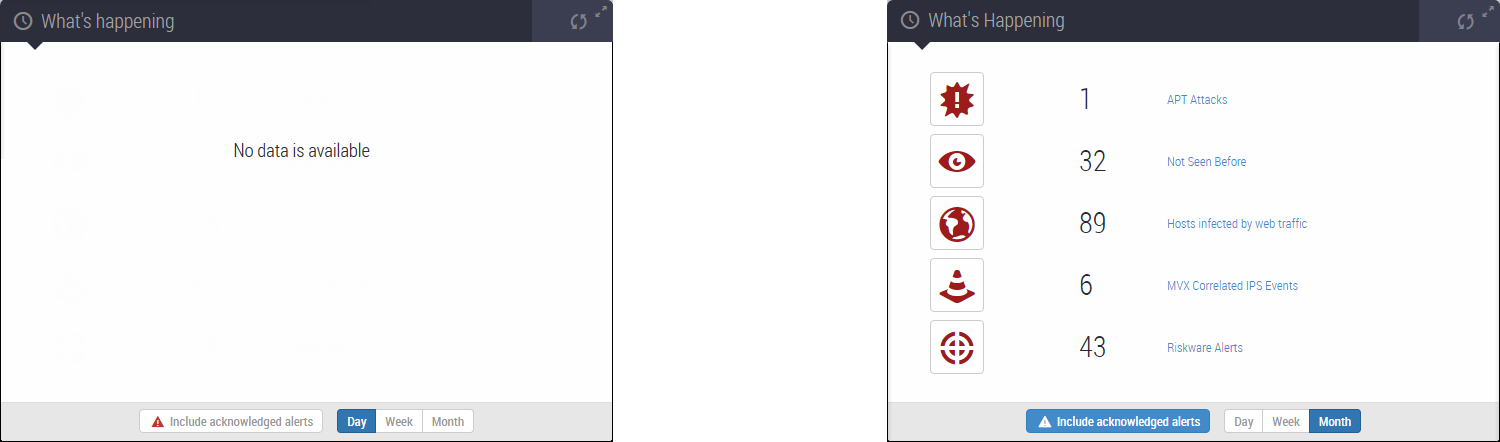
The following examples are two What's Happening panels for the same data. In the first example, the default display criteria do not select alerts in any attack category. In the second example, including acknowledged alerts and expanding the time frame causes the What's Happening panel to select alerts in five attack categories.