This topic describes how to display the results of IPS detection and blocking activities performed by your IPS platform.
When the IPS-enabled rules engine matches a traffic flow to an active IPS rule, the platform generates an IPS event. For client-targeted IPS events that correlate with MVX-verified malware alerts, the platform triggers IPS alerts.
IPS events and IPS alerts are listed in the IPS Events page.
IPS alerts for client-targeted attacks are listed in both the Hosts tab and the Alerts tab.
IPS event statistics are reflected in two panels in the Dashboard.
From the Reports page, you can generate IPS-specific reports that contain summaries and detailed information about HTTP-based malware alerts, IPS alerts, and IPS events.
If you configured FireEye event notifications for IPS events, notifications are sent using the notification methods you configured.
You can use this information to determine how to customize your configuration of IPS packet processing.
Prerequisites
Before you begin analyzing initial IPS results, perform the following prerequisite tasks:
Log in to the appliance Web UI as Monitor, Analyst, or Admin.
(Recommended) Configure notifications of IPS events.
(Optional) Disable or re-enable IPS block mode if needed.
Apply default IPS policies to monitoring interfaces.
Wait several minutes for IPS event detection to begin to appear in the Web UI.
Procedure
To display IPS data:
Choose IPS > IPS Events to verify that the IPS rules you activated are detecting IPS events.
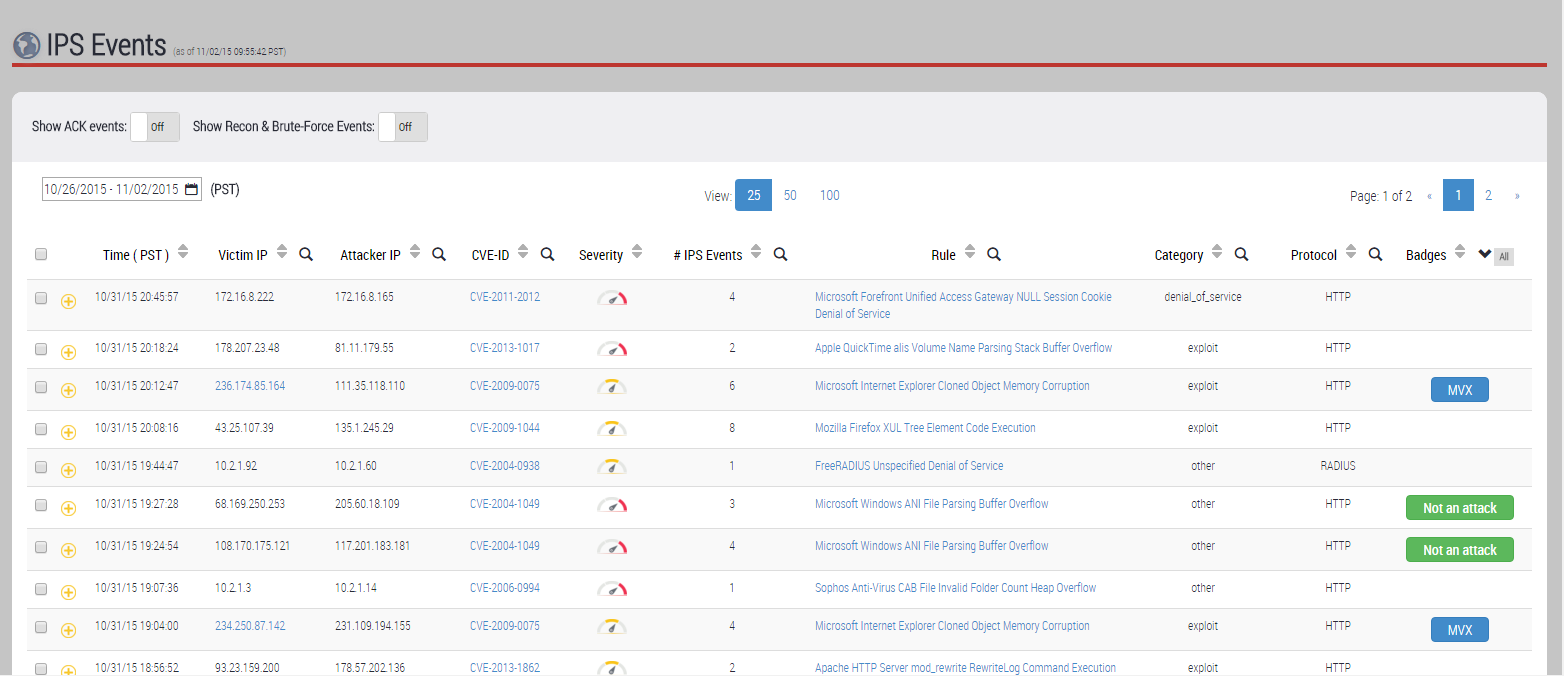
The IPS Events page lists all IPS events detected by the platform within the time frame specified by using the calendar icon (
 ).
).If an entry represents one or more MVX-correlated IPS events (IPS alerts), the following badge appears in the Badges column:

If an entry represents one or more IPS events that have been verified to be non-malicious, the following badge appears in the Badges column:

For more information, see About the IPS events page.
To display a list of all alerts triggered on the appliance, select the Alerts page. Different pages list malware alerts (MVX-verified malware events), IPS alerts (MVX-correlated IPS events), and callback events.
Hosts
This page lists all malware alerts and IPS alerts, grouped by victim IP address and attack rule name. Multiple alerts associated with the same victim and signature rule are combined in a single entry. If an entry represents one or more IPS alerts, the following badge appears in the IPS column:

For more information, see Alerts grouped by victim IP addresses.
Alerts
This page lists all malware alerts and IPS alerts, grouped by attack rule name only. Multiple alerts associated with the same signature rule are combined in a single entry. If an entry represents one or more IPS alerts, the following badge appears in the IPS column:
For more information, see Alerts grouped by attack rule names.
Callback Activity
This page lists all callback events associated with a malware alert. For more information, see Alerts grouped by CnC servers contacted.
For a high-level view of the IPS-specific threat intelligence gathered by the IPS platform, select the Dashboard page and view the following Dashboard panels:
What's Happening
For IPS platforms, this panel includes the count of IPS alerts detected by the appliance, provided that the value is not zero.
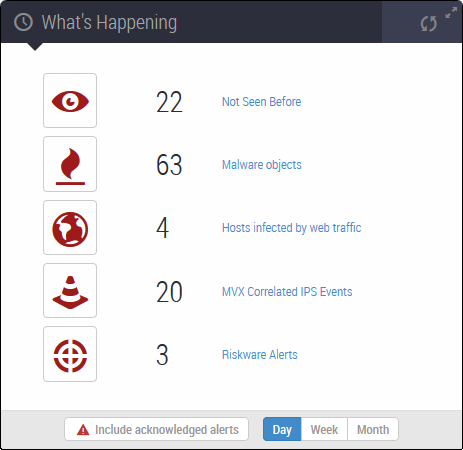
Click MVX Correlated IPS Events to open the IPS Events page filtered to display only IPS alerts.
IPS Trend
For IPS platforms, this panel contains a two-series line graph that plots the number of IPS alerts and IPS critical events detected by the appliance over the past month, week, or day of IPS analysis.
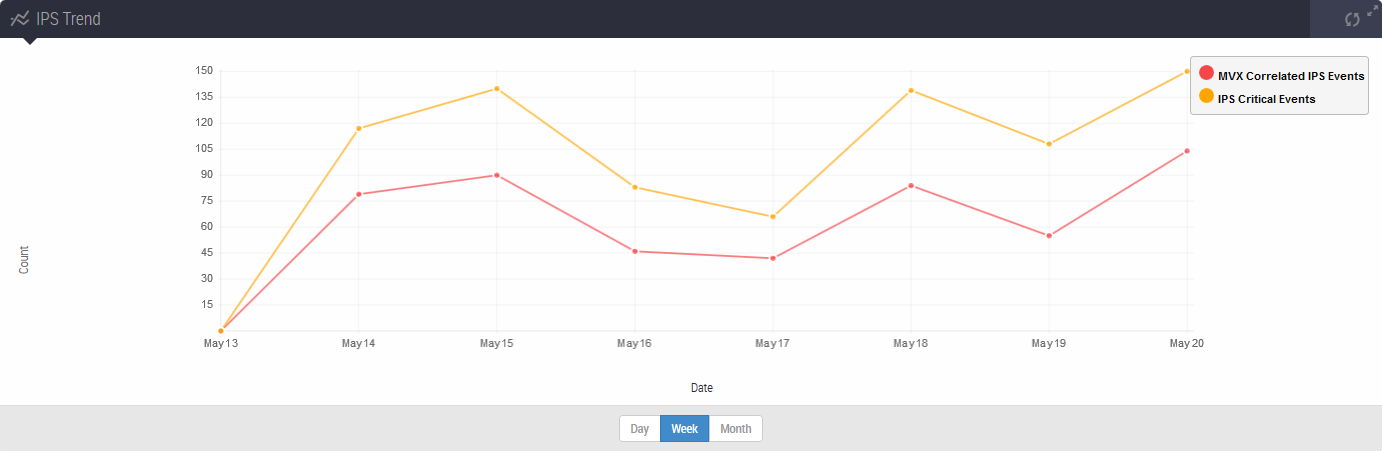
For more information, see IPS information in the dashboard.
To generate IPS-specific reports, select the Reports page. The following reports are available on IPS-enabled platforms only:
IPS Executive Summary
Provides a high-level view of IPS statistics.
IPS Policy Configuration Summary
Identifies IPS policies active on monitoring interfaces; counts the active IPS rules and excluded IPS rules at each active monitoring interface; and summarizes the characteristics of the active IPS rules at each active monitoring interface.
IPS Policy Configuration Details
Provides the same information as the IPS Policy Configuration Summary, but also lists the active rules, excluded rules, and included rules at each monitoring interface.
IPS Top N Attacks
Extracts traffic analysis statistics about IPS rules used to detect suspicious events.
IPS Top N Attackers
Extracts traffic analysis statistics about hosts that sent suspicious traffic detected by IPS rules.
IPS Top N Victims
Extracts traffic analysis statistics about hosts that received suspicious traffic detected by IPS rules.
IPS Top N MVX‑Correlated
Provides the Top N Attacks, Top N Attackers, and Top N Victims reports.
For more information, see IPS reports.
If you disabled IPS blocking mode while evaluating the fit of IPS rules to your environment, be sure to re‑enable IPS blocking mode after you finish customizing the configuration of IPS packet processing by your platform.