For IPS platforms only, the IPS Trend panel of the Dashboard plots the number of MVX-correlated IPS events (IPS alerts) and IPS critical events that occurred during the past day, week, or month. The following table describes the two IPS statistics in the graph.
Plot point | IPS data graphed | IPS data description |
|---|---|---|
 | MVX‑Correlated IPS Events | Number of IPS events (potential network threats detected using IPS rules) correlated with client-centric attacks verified by standard Network Security features. |
 | IPS Critical Events | Number of IPS events of severity category Critical (severity levels 7 through 10). |
By default, the IPS Trend panel covers the past one month of IPS-enabled analysis. The following example shows an IPS Trend panel that covers the past one week of analysis.
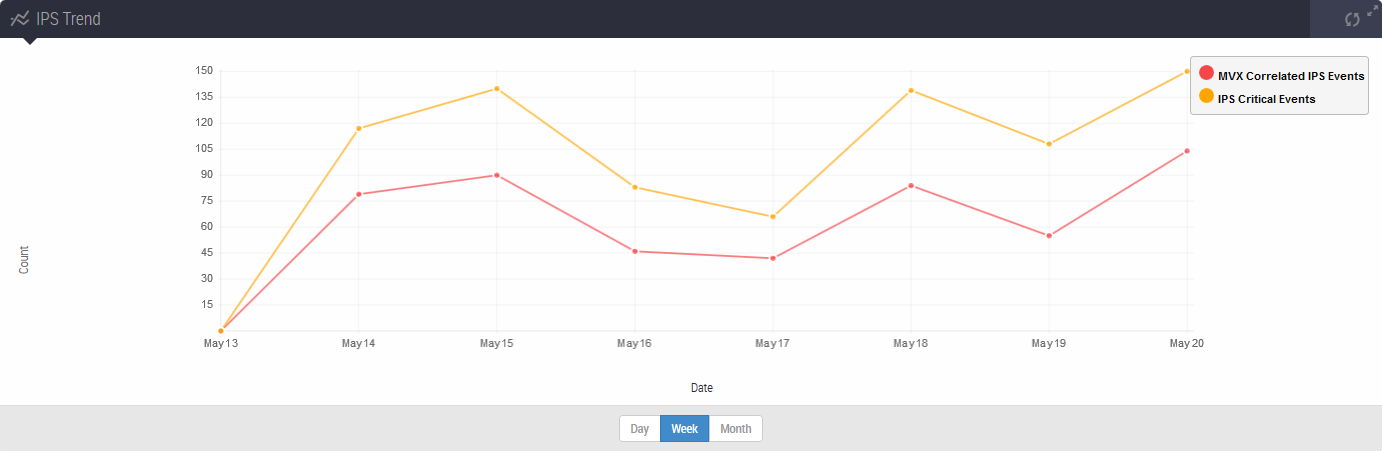
Use the controls at the bottom of the panel and in the legend to adjust the data displayed:
Change the period of time covered by the display (day, week, or month).
Show or hide either statistic.