The Devices → <Admin Domain Name> → Global → Sensor Health → Health Status page provides a consolidated view of all health-related faults generated for the Sensor in Manager. You can view these faults in admin domain including those configured in the child admin domains. The Health Status page provides a cumulative view of system health, processor health, resource usage, and traffic nature of all devices configured in the Manager.
Note
This feature is not applicable for NS3x00, NS9300, and Virtual-IPS Sensors.
Health Status
The Health Status page allows you to monitor the Sensor health and take necessary actions, if required. The following options are available in the Health Status page:
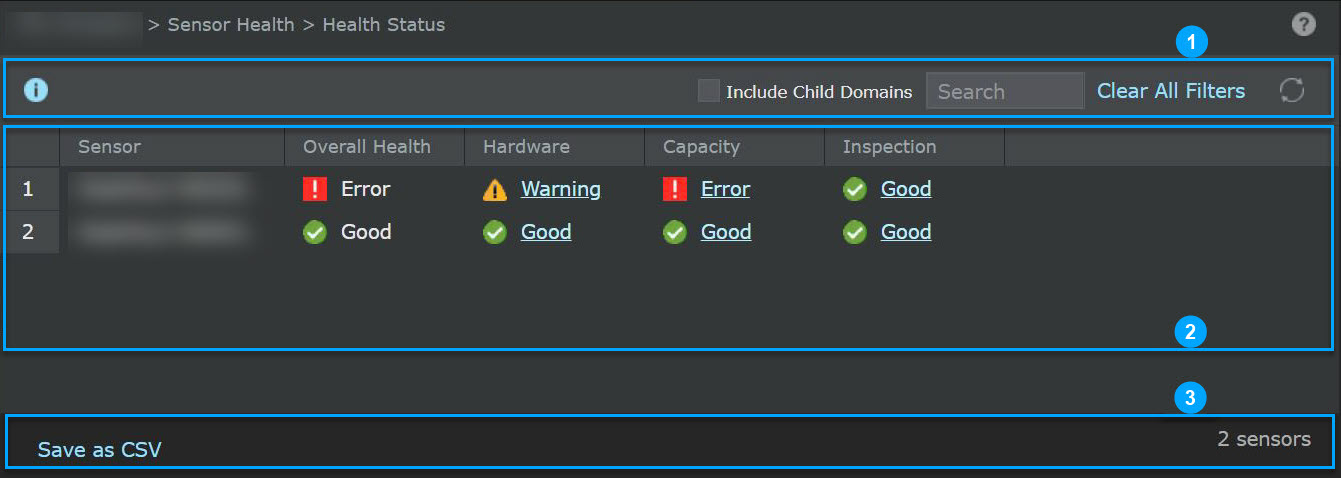
| Callout | Description |
|---|---|
| 1 | Top menu |
| 2 | Grid view |
| 3 | Bottom menu |
The details of callout options are as listed below:
| Options | Description |
|---|---|
| Top Menu | |

|
Provides an overview of Sensor Health page. |
| Include Child Domains | Displays the Sensors configured in the child domain. |
| Search | Enter a keyword in the Search field and results are automatically displayed. |
| Clear All Filters | Click Clear All Filters to undo applied filters. |

|
Refreshes the tab. |
| Grid View | |
| Sensor | Displays the name of the device. |
| Overall Health | Displays the following faults for overall health of the Sensor:
|
| Hardware | Displays the following faults when there are any abnormalities in the hardware:
|
| Capacity | Displays the following faults when the memory, CPU, and throughput usages of the Sensor breaches the threshold:
|
| Inspection | Displays the following faults for inspection summary:
|
| Bottom Menu | |
| Save as CSV | Downloads the device details for all devices as a .csv file. |
| <Number> sensor | Displays a total number of Sensors configured in the Manager. |
 Good: All indicators are good
 Error: One or more indicators have error
 Warning: One or more indicators have warning
The Health Status page can be customized by different options like sorting, filtering, and grouping which helps to drill-down the details based on your requirement. The following options are available:
- Sort Ascending: You can sort all columns in the ascending order.
- Sort Descending: You can sort all columns in the descending order.
- Columns: You can view the required columns by selecting each category from the list.
- Group by this field: You can group the device details based on specific sub category.
- Show in Groups: It allows you to disable Group by this field filter. By default, it is disabled.
- Filters: You can filter the faults based on its severity.
Hardware Summary
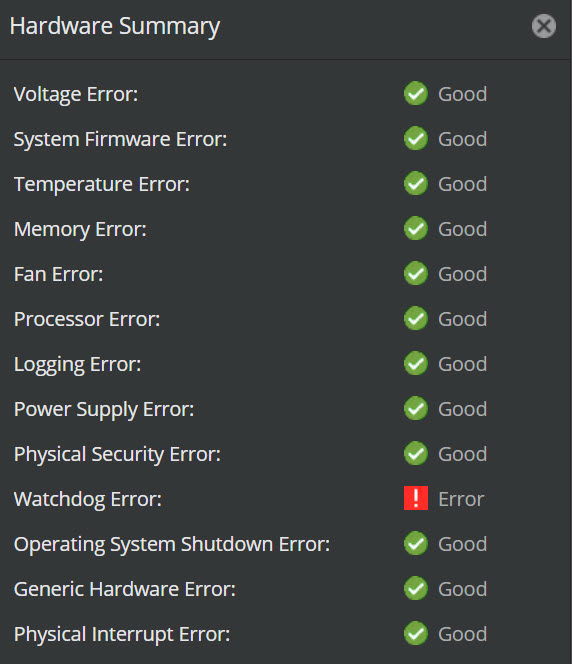
You can view the details of generated faults for all Hardware indicators by selecting the hyperlink from the Hardware column of Health Status page. You can monitor the device performance and take necessary actions. For the following parameters, faults are displayed:
Voltage Error: The device supplying the voltage or the device using the voltage can trigger the voltage error. Faults are generated, when this device voltage is outside its normal range.
System Firmware Error: The BIOS logs any POST (Power On Self Test) errors to the System Event Logs (SEL). This event is logged every time a POST error is displayed. Even though this event indicates an error, it might not be a fatal error.
Temperature Error: Multiple varieties of temperature Sensors can be implemented on Trellix IPS system. Now, they are split into three types: Regular, Thermal Margin, and Discrete temperature Sensors. Each of them have there own types of events and when their device temperature goes outside its normal range, faults are generated.
Memory Error: Trellix IPS system's BIOS reports multiple error codes from sticks of memory that populate slots in board. For example, DIMM (Dual In-line Memory Module) failed test/initialization or is disabled.
Fan Error: On the Trellix IPS system, speed Sensor fans are available. Faults are generated, when the device fan is not performing at expected capacity.
Processor Error: This event occurs only due to failures of thermal solution. Each processor has a status Sensor. This status Sensor indicates the processor presence or a thermal tip condition.
Logging Error: The Baseboard Management Controllers (BMC) logs a system clear event. This is the first event in the SEL. When logging is disabled for the device manually using any Intelligent Platform Management Interface (IPMI)-aware utility or in factory (as part of manufacturing process), faults are generated.
Power Supply Error: The Sensors monitors the status of power supplies in the system. If there is a failure, predictive failure, or a configuration error it generates faults.
Physical Security Error: Two Sensors are included in the physical security subsystem: Chassis intrusion and LAN leash lost.
- Chassis Intrusion: It is monitored on supported chassis. Faults are generated when the chassis lid is opened or closed.
- LAN Leash Lost: It monitors the physical connection on the onboard network ports. If a LAN leash lost event is logged, it indicates that the network port lost its physical connection.
Watchdog Error: Trellix IPS Server supports a watchdog timer, to check whether the operating system is still responsive. By default, this timer is disabled. An IPMI-aware utility is required to reset this timer before its expiry. If the timer expires, you can configure the BMC to take necessary actions.
Operating System Shutdown Error: An IPMI-driver integrated in the operating system aids the capability to log SEL events. When the system shuts down from the Windows operating system, multiple events could be logged such as, operating system stop/shutdown event and OEM record events.
Generic Hardware Error: The BMC is configured to send alerts for events logged into the SEL. These alerts are called as Platform Event Filters (PEF). By default, it is disabled. You can enable the PEF filters manually using any IPMI-aware utility. PEF events are logged, if the BMC responds due to a PEF configuration. The BMC event triggers the PEF action in SEL. This function is built into BMC to allow it to send alerts (SNMP or other) for any event that gets logged to the SEL.
Physical Interrupt Error: The following includes types of physical interrupt error:
- Frontend Panel Non-Maskable Interrupt Error: The front panel interrupt button (also referred as NMI button) is a recessed button, that allows you to force a critical interrupt which triggers a crash error or kernel panic.
-
Peripheral Component Interconnect express Error: PCIe stands for Peripheral Component Interconnect express. It is an interface standard that is used to connect high-speed components. The motherboard has several PCIe slots to connect different components such as GPU (or video cards or graphics cards), Wi-Fi cards, SSD (Solid-state drive).
PCIe error events are either correctable (informational event) or fatal. In both cases information is logged to help identify the source of the PCIe error and the bus, device, and function is included in the extended data fields. The PCIe devices are mapped in the operating system by bus, device, and function. Each device is uniquely identified by the bus, device, and function. PCIe device information can be found in the operating system.
For more information about Hardware Summary, see Intel-SEL Troubleshooting guide.
Note
The faults for Voltage Error, System Firmware Error, Memory Error, Processor Error, Logging Error, Physical Security Error, Watchdog Error, Operating System Shutdown Error, and Physical Interrupt Error are displayed only for 10.1.5.190 Sensors and above.
Faults are generated based on severity. Trellix recommends you to take required actions to correct the generated faults. For more information, see Sensor Faults section.
Capacity Summary
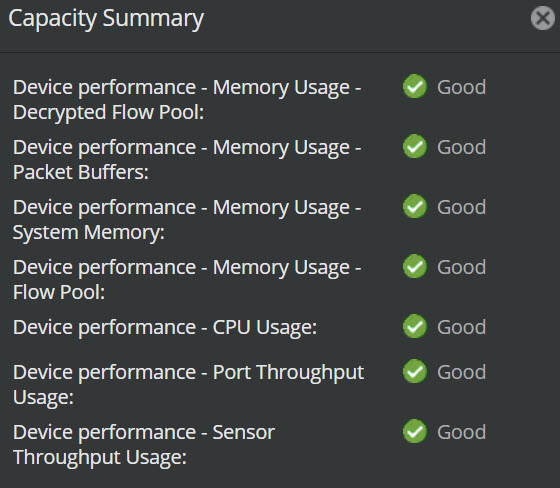
You can view the details of generated faults by selecting the hyperlink from the Capacity column of Health Status page. For the following parameters, faults are displayed:
-
Device Performance - Memory Usage: When the memory usage breaches the threshold, faults are generated. You can view the faults for the following metrics:
- Device Performance - Memory Usage - Decrypted Flow Pool: Memory allocated to inspect decrypted SSL flows.
- Device Performance - Memory Usage - Packet Buffers: Packet buffer used by the Sensor.
- Device Performance - Memory Usage - System Memory: System memory used by the Sensor.
- Device Performance - Memory Usage - Flow pool: Memory allocated to inspect all flows.
- Device Performance - CPU Usage: CPU Usage is the usage that represents the combined usage of software processing in the datapath together with the throughput usage in the Sensor. You can monitor the CPU usage before it reaches the threshold limit. By default, a fault message is generated if the CPU usage goes beyond 90%.
- Device Performance - Port Throughput Usage: Displays the faults, when the port throughput utilization breaches the threshold value for a selected device.
- Device Performance - Sensor Throughput Usage: Displays the faults, when the Sensor throughput utilization breaches the threshold value for a selected device.
Inspection Summary
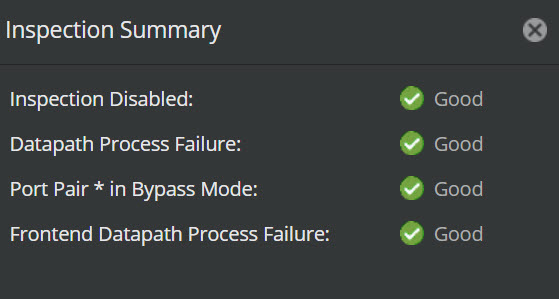
You can view the details of generated faults by selecting the hyperlink from the Inspection column of Health Status page. For the following parameters, faults are displayed:
- Inspection Disabled: When the device is operating in layer 2 bypass mode, inspection is disabled.
- Datapath Process Failure: When the device has detected a failure in the datapath process, which might impact datapath inspection.
- Port Pair * in Bypass Mode: When the device is configured in the inline fail-open mode, but it is in bypass mode. The port pair is not inspecting traffic.
- Frontend Datapath Process Failure: When the device has detected a failure in the front-end datapath process, which might impact datapath inspection.
Details Panel
For a particular Sensor, you can view the device details by double-clicking anywhere on the selected device. An Abnormal health details of <Sensor Name> panel is displayed at the right end of the page .
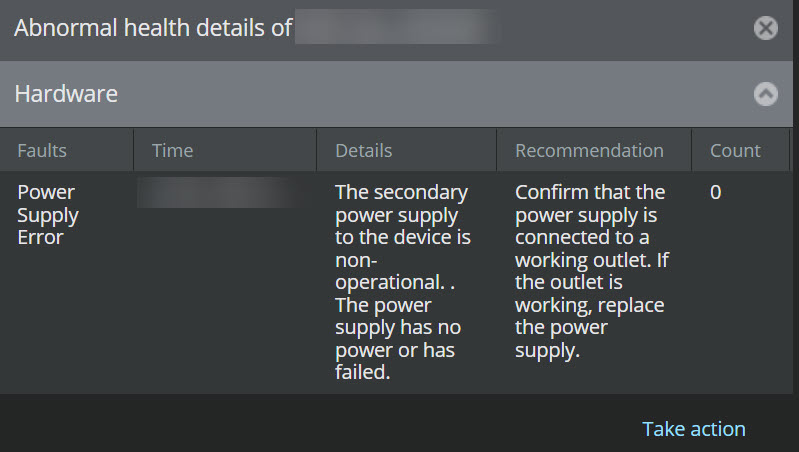
This panel displays the following details:
- Faults: Displays the name of the indicators where the faults are observed.
- Time: Displays the time stamp for all generated faults.
- Details: Displays the details of all factors that trigger faults.
- Recommendation: Displays a few basic troubleshooting steps for resolving the generated faults.
- Count: Displays a total number of the same faults generated for the Sensor.
The Take action enables you to access the Faults window. It displays all faults generated within the time range i.e., the interval between the occurrence of the first fault and the present time. By default, the Faults window displays all faults generated for a selected Device and its Sub Category. On selecting Clear All Filters, you can remove all applied filters and view overall faults.
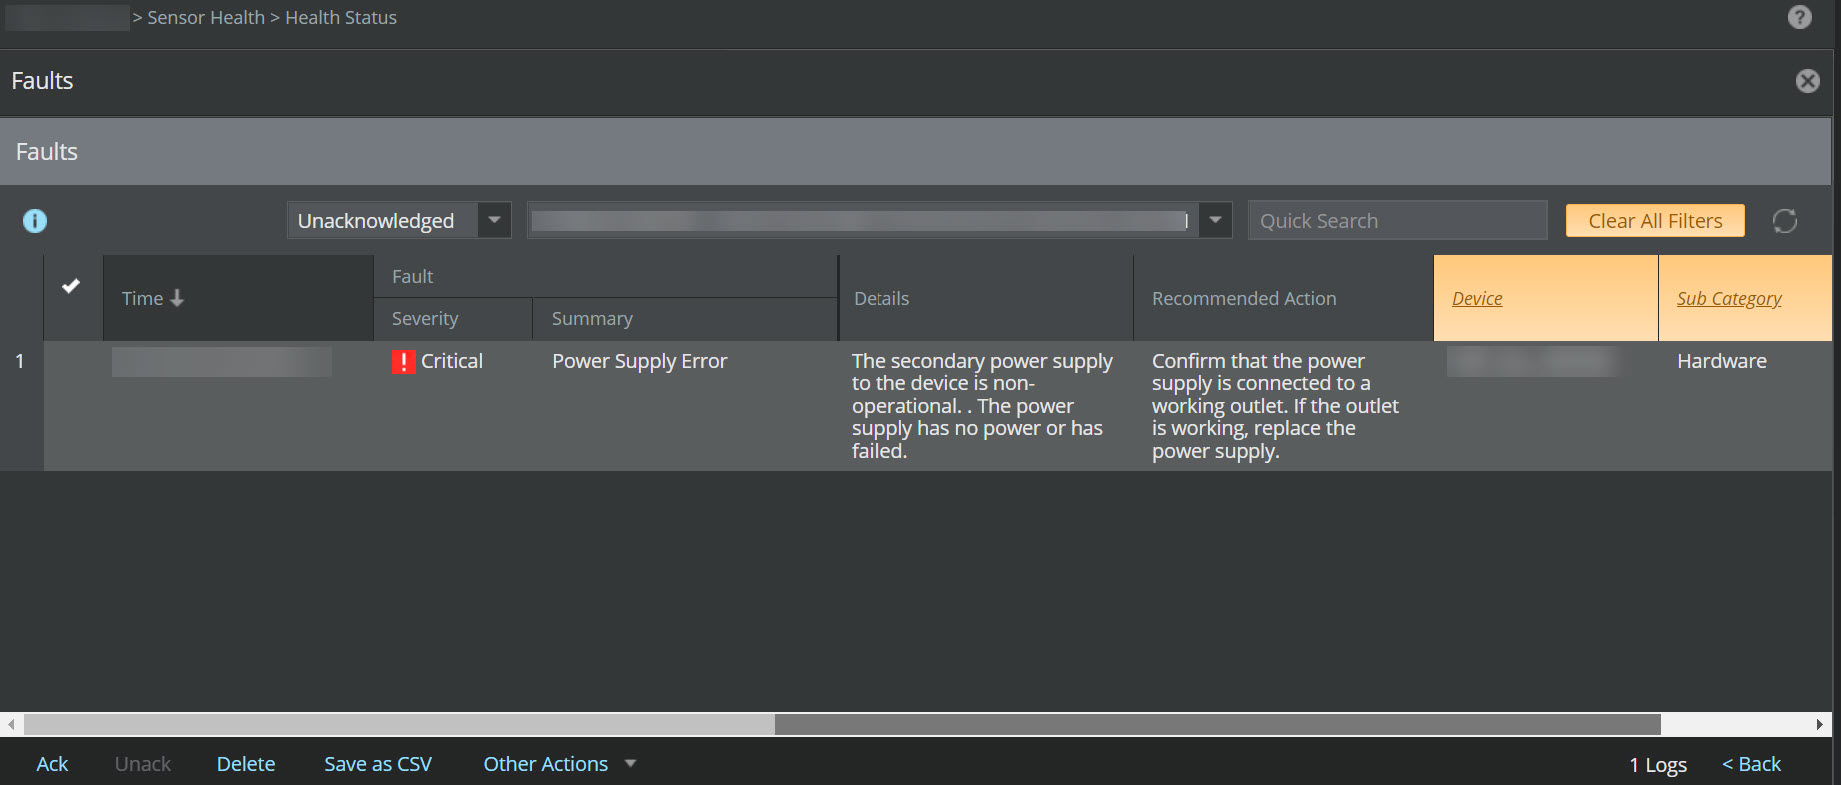
This window is similar to the
Faults tab in the
Manager → Admin Domain Name → Troubleshooting → Logs except, it displays the faults only for a selected
Device,
Time, and its
Sub Category. All actions that can be performed in the
Faults tab of
Logs page can be performed through this window. You can click
.png) or
or
 to go back to the
Health Status page. For more information, see the
Faults section.
to go back to the
Health Status page. For more information, see the
Faults section.