The new docs.trellix.com features a modernized UI and AI-powered conversational search. Content is currently available in English, with additional languages launching in early November 2026. We hope you enjoy the updated experience.

View device summary details

Prev Next

The Devices → <Admin Domain Name> → Devices → <Device Name> → Summary action presents a view of the configured information for an installed device. For HA pair, Devices → <Admin Domain Name> → Devices → Member Sensors → <HA Pair Node> → Summary action presents a view of the configured information for an installed device that is part of a HA pair. For Sensors in a stack, the Devices → <Admin Domain Name> → Devices → <Device Name> → Member Sensors → <Stackname-node Id> → Summary action presents a view of the configured information for an installed device that is part of a stack.

The information displayed is configured during the installation and initialization of the selected device through the device command line interface.

In the Device Details monitor, verify that the Name, IP address, subnet mask, and default gateway IP address are the same as what you set through the command line interface for the selected device.

When the Sensor is configured with dual stack (IPv4 and IPv6 addresses), following fields in the Summary page displays only the IP address on which trust was established between the device and the Manager.

  • IP Address Connected to Manager
  • Subnet Mask
  • Default Gateway

For example, if you configure both IPv4 and IPv6 addresses in the Sensor, but establish trust with the Manager on IPv4, then the Summary page displays only the IPv4 address for IP Address Connected to Manager, Subnet Mask, and Default Gateway.

Follow this procedure to view the summary of the device configurations:

For standalone Sensors, go to Devices → <Admin Domain Name> → Devices → <Device Name> → Summary.

For HA pair, go to Devices → <Admin Domain Name> → Devices → Member Sensors → <HA Pair Node> → Summary.

For Sensors in a stack and a HA pair of stack Sensors, Devices → <Admin Domain Name> → Devices → <Device Name> → Member Sensors → <Stackname-node id> → Summary.

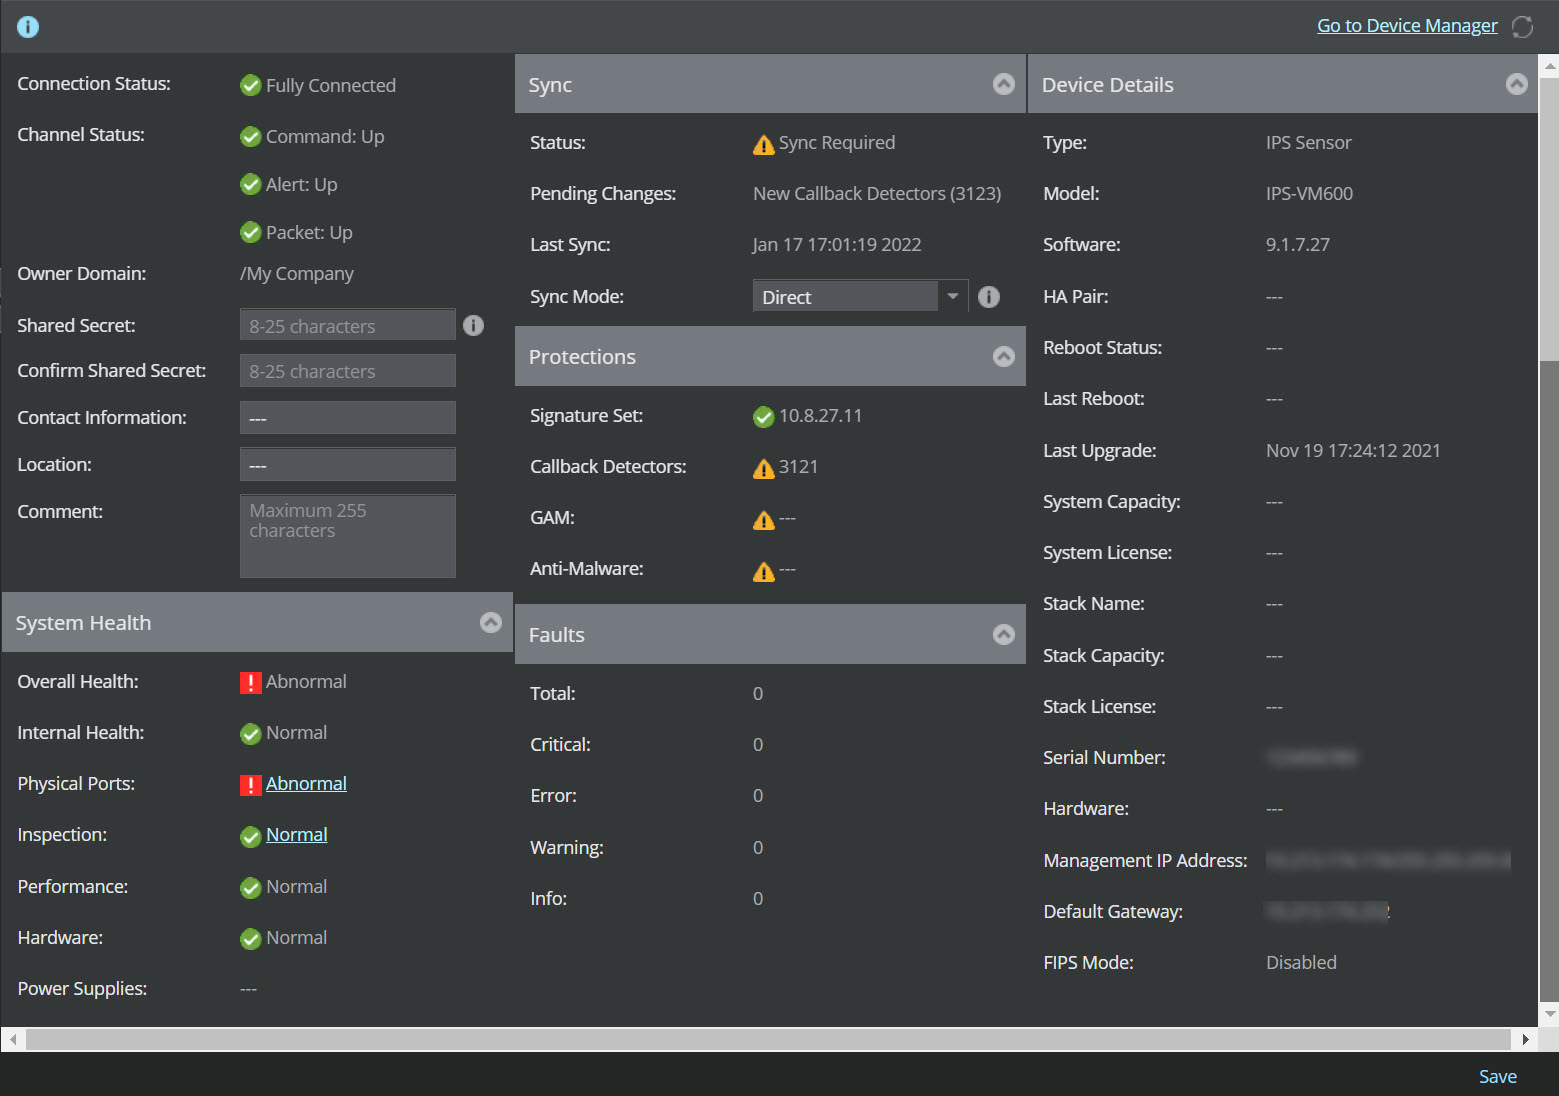
The Summary page is displayed. It contains the following information:

Device details Definition
General Settings Displays the following parameters:
  • Connection Status - Displays the status between the Sensor and the Manager as Fully Connected, Partially Connected, Disconnected, or Trust Pending.
  • Channel Status - Displays the name of the following channels and its status whether "Up" or "Down" :
    • Command
    • Alert
    • Packet

    If the trust is not established between the Manager and Sensor, the Channel Status is displayed as ---.

  • Owner Domain - Displays the name of the owner domain.
  • Shared Secret - You can edit the shared secret key.

    The device shared secret key can contain up to 25 alphanumeric characters, including hyphens, underscores, and periods.

    Caution

    This should only be performed if the shared secret in the device shell (command line interface) has been changed. When one of the shared secrets is changed, the device loses communication with the Manager.

  • Confirm Shared Secret - Confirm the shared secret key.
  • Contact Information - Type the details of the person responsible for this device.
  • Location - Type the geographic (city, building, and others) location.
  • Comment - Type the comments.

To update the modified configurations, click Save.

System Health
  • Overall Health - Displays the overall health of the system as Normal, Abnormal, or ---.
  • Internal Health - Displays the Sensor health as Normal, Abnormal, or ---.
  • Physical Ports - Displays the status of ports operating as Normal, Abnormal, or ---.

    Click the link to navigate to the Physical Ports page of the device.

  • Inspection - Displays if the device is in layer 2 bypass mode as Normal or Abnormal.

    Click the link to navigate to the Layer 2 Bypass page of the device.

  • Performance - Displays the performance related faults for the device as Normal or Abnormal.

    Click the link to navigate to the Performance Charts page.

  • Hardware - Displays if the hardware has any temperature or power related issues as Normal or Abnormal.
  • Power Supplies - Displays the power supply status as Operational, Non Operational, Absent, Error, and ---.

Note

  • For NS9300 Sensor, four units of power modules and power supply status are displayed.
  • The NS3x00 Sensors do not support Secondary power supply module thus, the status of only Primary power supply module is displayed.
Sync Displays the sync details for the following parameters:
  • Status - Displays the following status:
    Status Description
    Synchronized Indicates that no pending changes are required.
    Sync in progress Indicates if any pending changes are required.
    Sync required Indicates when the deployment is in progress.
    --- Indicates that there is no trust established between the Sensor and Manager.
  • Pending Changes - Displays the configuration changes updated to the device including signature set or callback detectors.
  • Last Sync - Displays the date and time of the last sync.
  • Sync Mode - Displays the configuration mode as Direct for online updates and Indirect for offline updates.

    You can edit the mode from Sync mode drop-down. Select the required mode and click Save.

Protections

Displays if the versions for the following protection parameters are latest not:

  • Signature Set
  • Callback Detectors
  • GAM (Gateway Anti-Malware engine)
  • Anti-Malware engine

The following icons are displayed:

  • : Displayed when the parameter has the latest version available
  • : Displayed when the version available in the Manager differs with the version available in the Sensor.
  • : Displayed when there is no latest version available on the Manager.
  • : Displayed when the latest version cannot be determined as the deployment is possibly in an air-gap network.

    Note

    This is displayed only for GAM and Anti-Malware.

Faults Displays the number of system faults generated for the following parameters:
  • Total - Displays the number of unacknowledged faults generated for the device.
  • Critical - Displays the number of critical faults generated for the device.
  • Error - Displays the number of error faults generated for the device.
  • Warning - Displays the number of warning faults generated for the device.
  • Info - Displays the number of info faults generated for the device.

A Faults window is displayed on selecting the tooltip icon for a particular fault.

Device Details Displays the device details for following parameters:
  • Type - Displays the type of device.
  • Model - Displays the model of device.
  • Software - Displays the device software version.
  • HA Pair - Displays the name of HA pair.
  • Reboot Status - Displays if the Sensor requires a reboot. This is required to deploy configuration changes to the Sensor without any failure.

    Note

    This is not applicable to NTBA appliances. It is displayed as ---.

  • Last Reboot - Displays the time stamp of last reboot.
  • Upgrade Status - Displays the status of the upgrade as Successful , In-progress, Failed , or ---.
  • Last Upgrade - Displays the time stamp of last upgrade.
  • System Capacity - Displays the throughput for the Sensor.

    Note

    The information is displayed only for NS3500, NS9500, and NS7500 Sensors.

  • System License - License: Displays the license details of Sensor.
  • Stack Name - Displays the name of the Stack.
  • Stack Capacity - Displays the throughput for the stack.
  • Stack License - Displays the license details of stack.
  • Serial Number - Displays the device serial number.
  • Hardware - Displays the version details of hardware.
  • Management IP Address - Displays the IP address/subnet mask of device.
  • Default Gateway - Displays the IP address of the default gateway configured on device.
  • FIPS Mode - Displays if FIPS mode is enabled or disabled.

    Note

    This is not applicable to NTBA appliances. It is displayed as ---.

Go to Device Manager You can access the Device Manager from this link.
Save Saves the modified updates.
Refreshes the page.

For more information, refer Sensors tab.


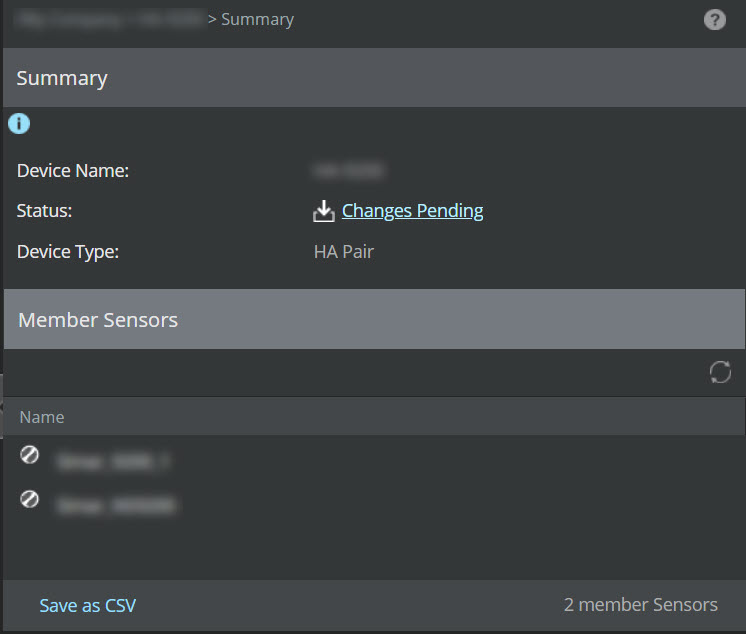
Summary details of HA Pairs

The Devices → <Admin Domain Name> → Devices → <HA Pair Name> → Summary action presents a view of the configured information for installed HA Pairs. It displays the following details:

Options Definition
Device Name Displays the name of configured HA Pair.
Status Displays the status of device.
Device type Displays the device type as HA Pair.
Member Sensors
Refreshes the page.
Name Displays name of the Sensors configured as HA Pair.

If the Sensor is connected, <Sensor Name> is displayed.

If the Sensor is disconnected, <Sensor Name> is displayed.

Save as CSV Downloads the device details for all the devices as a .csv file.
<Number> member Sensors Displays the total number of member Sensors available in the Manager.


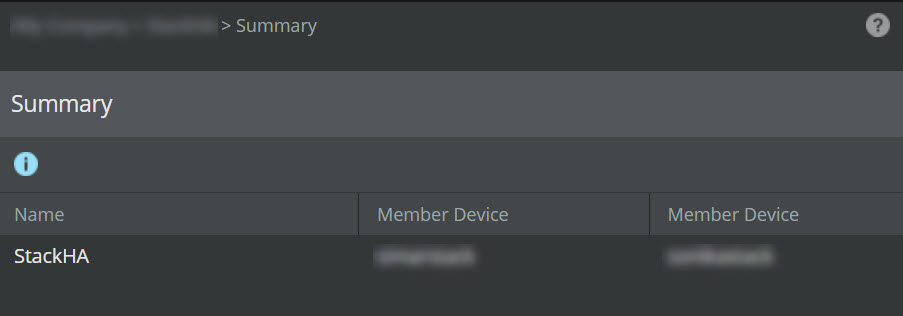
If the HA Pair is a HA Pair of Stacks, the Name and Member Device details are displayed.
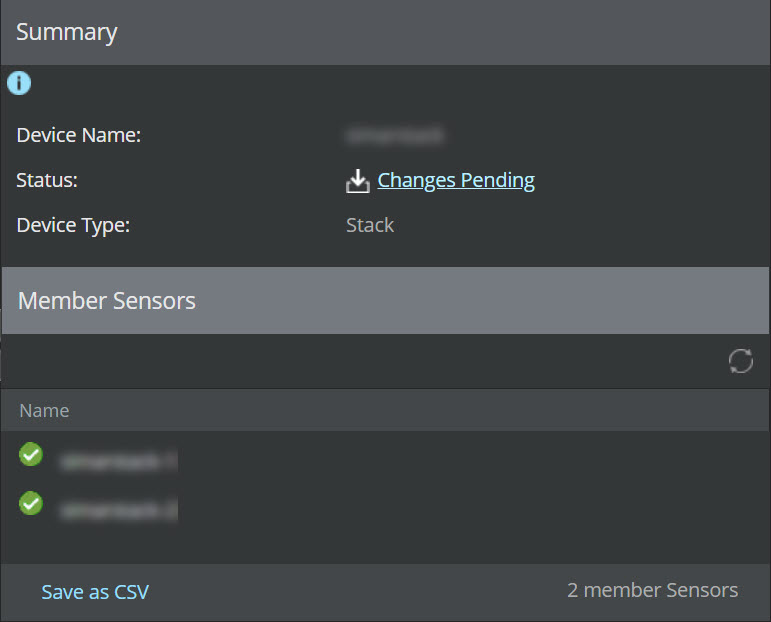
Summary details of the Sensors in Stack

The Devices → <Admin Domain Name> → Devices → <Stack Name> → Summary action presents a view of the configured information for the Sensors in Stack. It displays the following details:

Options Definition
Device Name Displays name of the configured Sensors in Stack.
Status Displays the status of device.
Device type Displays the device type as Stack.
Member Sensors
Refreshes the page.
Name Displays name of the Sensors in Stack.

If the Sensor is connected, <Sensor Name> is displayed.

If the Sensor is disconnected, <Sensor Name> is displayed.

Save as CSV Downloads the device details for all the devices as a .csv file.
<Number> member Sensors Displays the total number of member Sensors available in the Manager.