Top-right menu
The following options are available on the top-right corner of the Sensors tab:
Options | Description |
|---|---|
Include Child Domains | Displays the Sensors configured in the child domain. |
Clear All Filters | Click Clear All Filters to undo all filters applied. |
Filter and sort options
The Device Manager page can be customized by different options like filtering and sorting which helps to drill-down the necessary details based on your requirement.
Filter: All the columns in the Device Manager page can be filtered based on specific fields and view a consolidated list of details.
Sort: All the columns in the Device Manager page can be sorted in the ascending or descending order.
Grid view
The following columns are available in the grid view of the Sensors tab:
Option | Definition |
|---|---|
Name | Displays the name of the device.
|
Connection Status | Displays the status between the Sensor and the Manager.
|
Channel Status | Displays the name of the following channels and its status whether "Up"
If the trust is not established between the Manager and Sensor, the Channel Status is displayed as ---. |
Protections | Displays if the versions for the following protection parameters are latest not:
The icons displayed for the parameters are as follows:
|
Device Details | |
Type | Displays if the device is an IPS Sensor or an NTBA Appliance. |
Model | Displays the Sensor model. |
Serial Number | Displays the Sensor serial number. |
Software | Displays the software version running on the Sensor. |
Hardware | Displays the current hardware version running on the Sensor. |
Reboot Status | Displays if the Sensor requires a reboot. This is required to deploy configuration changes to the Sensor without any failure.
|
Upgrade Status | Displays if the latest software version is installing on the Sensor or downloading the latest software version to the Manager before installing it on the Sensor.
|
vIPS Cluster | Displays the name of the vIPS Cluster. For non-vIPS Clusters, "---" is displayed.
|
vIPS Probe | Displays the vIPS Probe version running on the member Sensor. For non-vIPS Probe, "---" is displayed.
|
Cloud Cluster Id | Displays the Cluster ID for the vIPS Clusters. For non-vIPS Clusters, "---" is displayed.
|
Last Upgrade | Displays the date, time, and year of the last software upgrade. |
System | Running Capacity: Displays the throughput of the Sensor.
|
License: Displays one of the following:
Click on the tooltip icon to assign or change the license. For more information, see Assign a license to a Sensor in Trellix Intrusion Prevention System 10.1.x Installation Guide. | |
Stack | Name: Displays the name of the stack of NS9500 Sensors. |
Capacity: Displays the throughput for the stack. | |
License: Displays one of the following:
Click on the tooltip icon to assign or change the license. For more information, see Assign a license to a Sensor in Trellix Intrusion Prevention System 10.1.x Installation Guide. | |
HA Pair | If the device is a part of a HA pair, it displays the name of the HA pair the device belongs to. |
Management IP Address | Displays the IP address of the management interface in the device and the subnet mask IP address. |
Default Gateway | Displays the IP address of the default gateway configured on the Sensor. |
FIPS Mode | Displays if FIPS mode is enabled or disabled.
|
Last Reboot | Displays the date and time of the previous reboot of the Sensor. |
Owner Domain | Displays the admin domain name or the child admin domain name to which the device belongs. |
Comment | Displays the location and contact information. |
System Health | |
Overall Health | Displays the overall health of the system.
|
Internal Health | Displays the Sensor health.
|
Physical Ports | Displays if the ports are operating normally or abnormally.
Click the link to navigate to the Physical Ports page of the device. |
Inspection | Displays if the device is in layer 2 bypass mode.
Click the link to navigate to the Layer 2 Bypass page of the device. |
Performance | Displays if there are any performance related faults for the device.
|
Hardware | Displays if the hardware has any temperature or power related issues.
|
Power Supplies | Displays the power supply status. The following are the status of the power supply:
For NS-series Sensors, two units of power modules and power supply status are displayed:
|
Faults | |
Total | Displays the number of unacknowledged faults generated for the device. Click the link to navigate to the Faults window. |
Critical | Displays the number of critical faults generated for the device. |
Error | Displays the number of error faults generated for the device. |
Warning | Displays the number of warning faults generated for the device. |
Info | Displays the number of info faults generated for the device. |
Sync | |
Status | Displays the synchronization state of the Sensor.
|
Pending Changes | Displays the configuration changes updated to the device including signature set or callback detectors. |
Last Sync | Displays the date and time of the last configuration change. |
Deployment Mode | Displays if the configuration update was online or offline. This is displayed as Direct for online update and Indirect for offline update. |
 Fully Connected: Indicates that all channels are up. The Sensor is able to communicate with the Manager.
  Partially Connected: Indicates that one or more channels are down.
  Disconnected: Indicates that the command channel is down. This occurs when the Sensor fails to communicate with the Manager.
  Trust Pending: Indicates that the Sensor is defined on the Manager but not on the Sensor.
  :
:  Expired: The license is assigned, but has expired.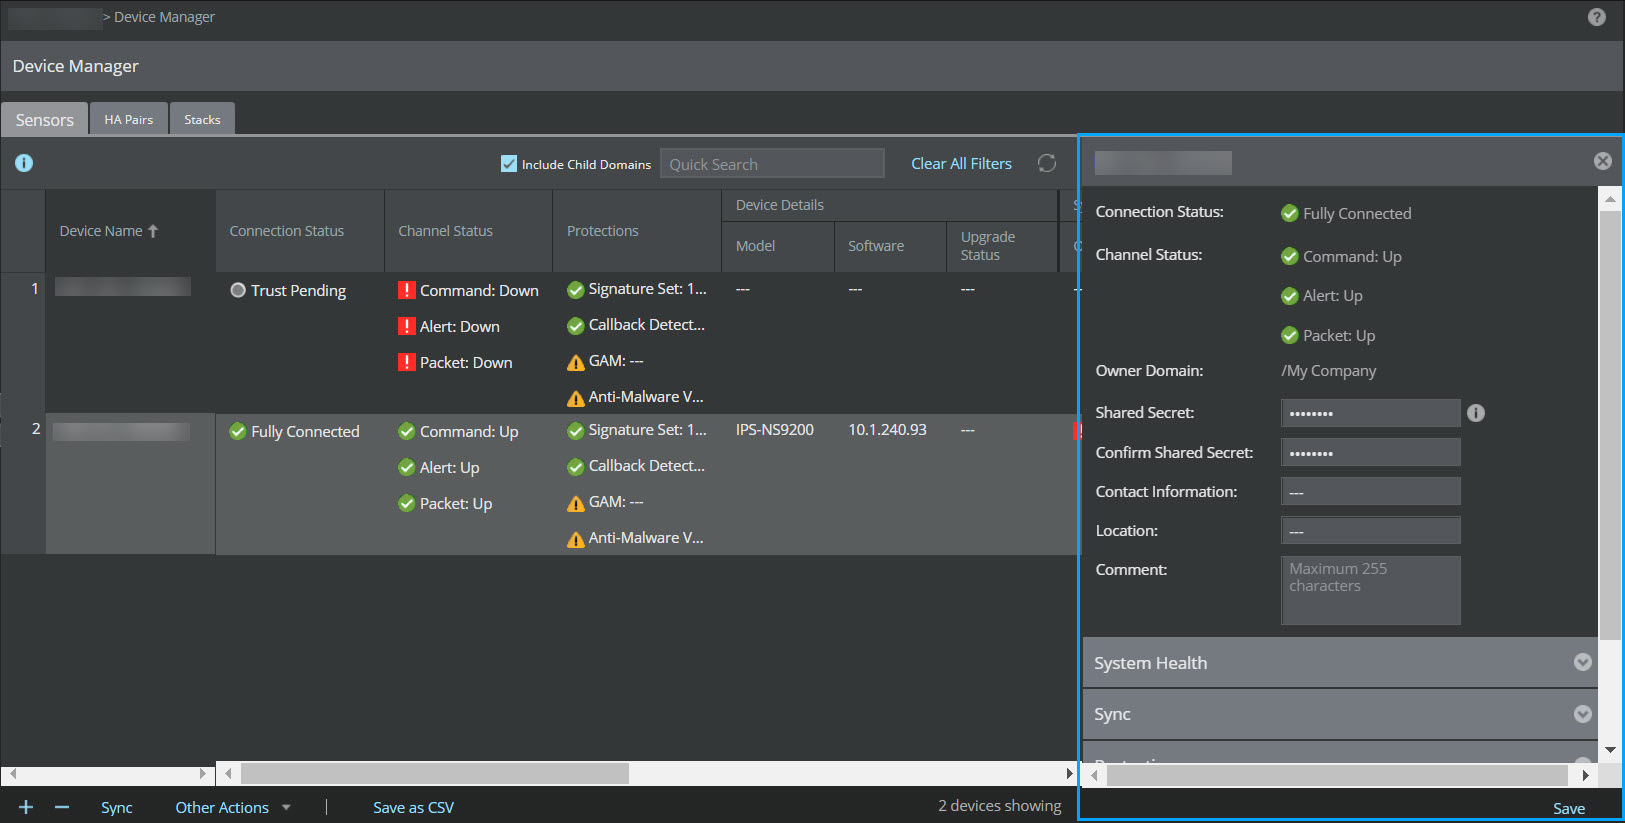
Bottom-left menu
The following options are available on the bottom-left corner of the Sensors tab:
Options | Description |
|---|---|
Sync | Deploys configuration changes for a single device or multiple devices at the same time. For more information, see Deploy pending changes to a device. |
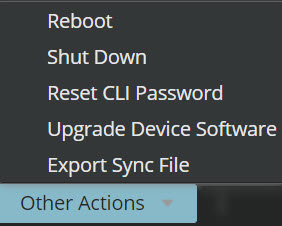
Other Actions | You can perform the following actions:
|
<Number> devices showing | Displays the total number of devices connected to the Manager. |
Faults
A Faults window is displayed on selecting the  tooltip icon for a particular fault on the Device Manager page. On selecting Clear All Filters, the Faults window displays all the faults generated for the selected Sensor.
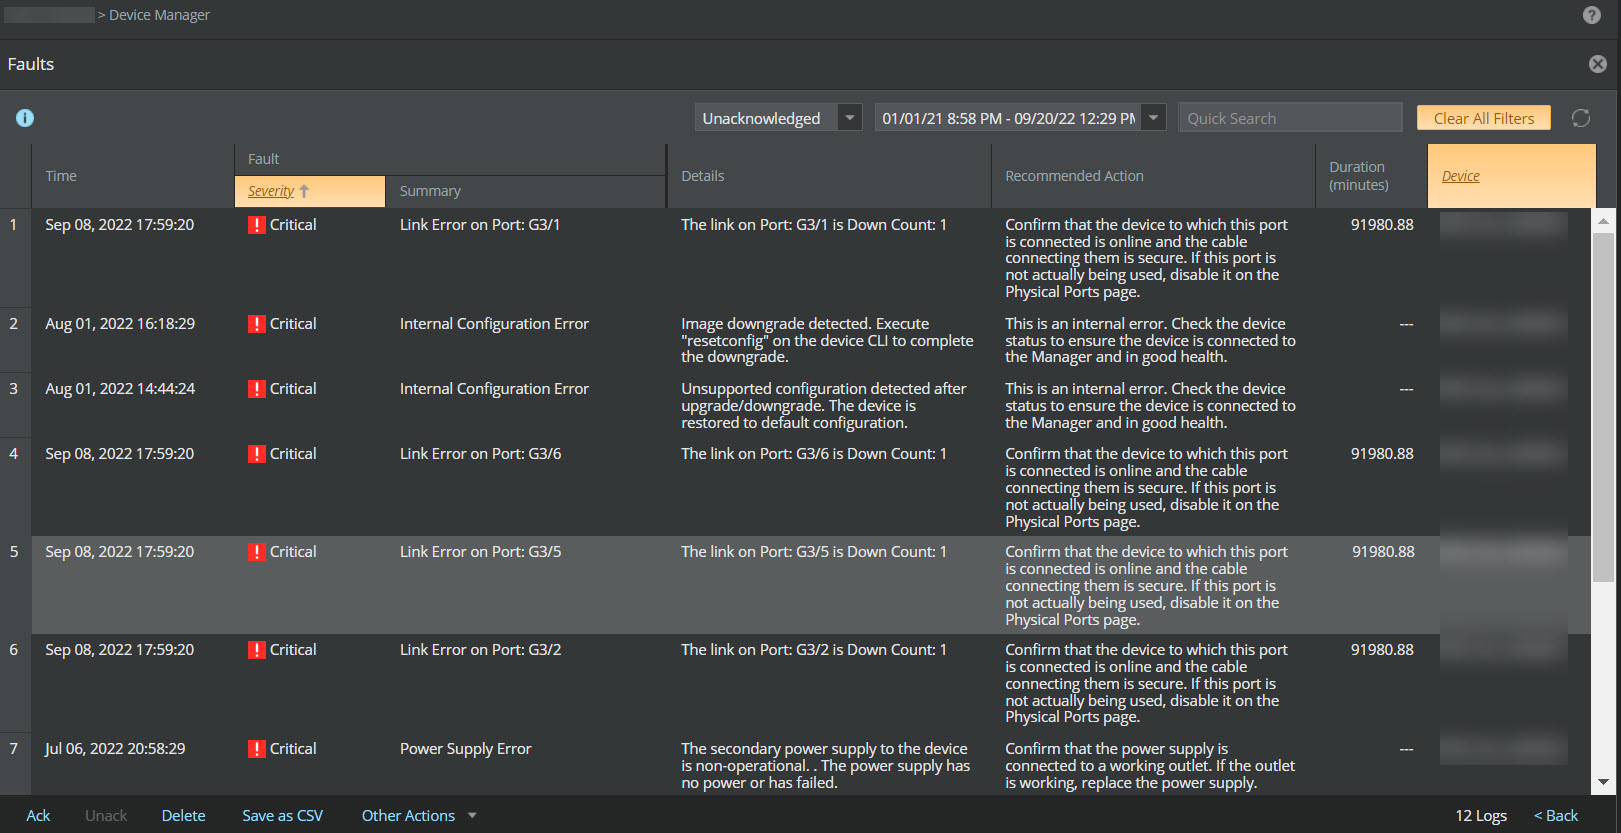
This window is similar to the Faults tab in the Logs page. Except, this window displays just the faults for the selected device based on the severity. All the actions that can be performed in the Faults tab in the Logs page can also be performed through this window.
For more information, see the Faults section.
Click .png) or
or  to go back to the Device Manager grid view.