This panel list the top 25 subnets in the monitored network, ranked by the total number of malware events detected during the past day, week, or month. By default, the panel displays malware callback event data for the past 24 hours.
For each subnet listed, the panel displays the following information:
Number of malware events detected
Number of unique malware events
Number of affected hosts (unique IP addresses in the Source IP column)
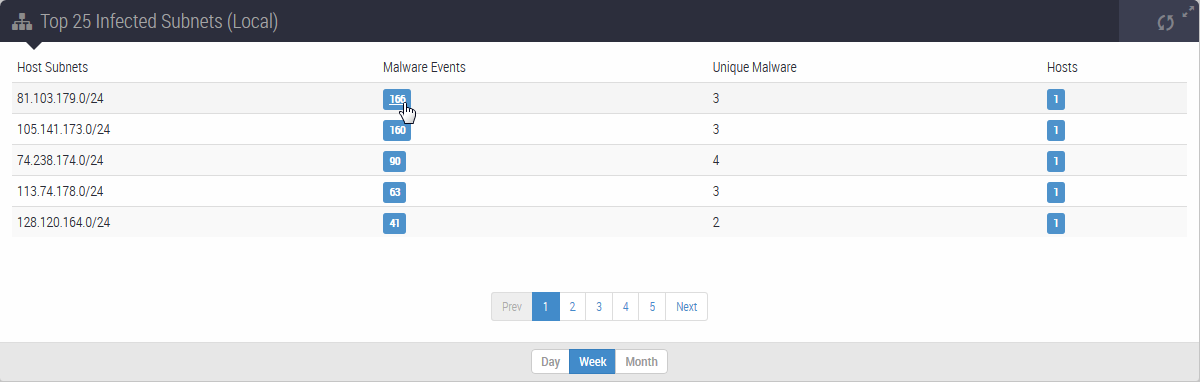
Use the controls at the bottom of the panel to adjust the data displayed:
Change the section of the list that appears in the panel (pages 1 through 5).
Change the period of time covered by the display (day, week, or month).
Two columns in the list contain shortcuts to filtered view of the Alerts tab and Hosts tab:
Click the number in the Malware events column to go to the Alerts tab. The tab lists Network Security alerts, grouped by attack rule name and filtered for an infected subnet. For details, see Alerts grouped by attack rule names.
Click the number in the Hosts column to go to the Hosts tab. The tab lists Network Security alerts, grouped by victim IP address and filtered for an infected subnet. For details, see Alerts grouped by victim IP addresses.
The following table lists the filter criteria for each column value shortcut in the list.
Column | Match values in the Alerts tab and Hosts tab | |
|---|---|---|
'Source IP' in the Alerts tab | 'Source IP' in the Hosts tab | |
Malware Events | IP address of the infected subnet | — |
Hosts | — | IP address of the infected subnet |