To adjust the data displayed in a Dashboard panel, use the following controls:
Dashboard panel control | Description |
|---|---|
| Display the panel in full screen mode. |
| Restore the panel to its original size. |
| Reload the data displayed in the panel. |
| Change the industry and region whose threat statistic is compared to that of the appliance. See Threat level |
| Cancel or save changes to the industry and region selection. See Threat level |
| Select which page of data appears in the panel. See Callback events |
| In any Dashboard panel that displays these buttons, you can select the period of time for which the panel displays information. |
| Choose the statistic to be shown in the panel: ● Hosts—Number of hosts affected ● Activities—Number of attacks |
| Data displayed excludes acknowledged alerts. Click to include acknowledged alerts. See What's happening |
| Data displayed includes acknowledged alerts. Click to exclude acknowledged alerts. See What's happening |
| Data displayed includes the labeled category Click to exclude the labeled data. See Threat attacks, |
| Click to include the labeled data in the data displayed. |








Some Dashboard panels have shortcuts to detailed information in other parts of the Web UI.
Dashboard panel shortcut | Description |
|---|---|
| Within a list, click a number icon to view the individual alerts entries in the Hosts tab or Alerts tab. See Callback events |
| Within a list, click a text link to view the individual alerts entries in the Hosts tab or Alerts tab. See What's happening. |
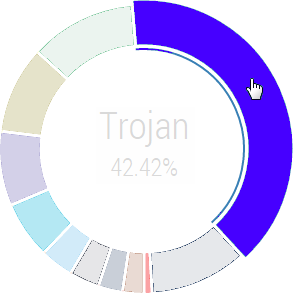
| Within a pie chart, click a segment to view the individual alerts entries in the Hosts tab or Alerts tab. See Critical malware detection and Threat attacks. |